Dzięki odpowiednim danym sprzedawcy detaliczni mogą śledzić wydajność półek, identyfikować obszary problemowe i zwiększać widoczność towarów. W tym miejscu do gry wkracza analityka planogramów i raportowanie sklepów.
W tym artykule dowiesz się, jak mierzyć wydajność planogramu przy użyciu praktycznych danych sprzedażowych i jak PlanoHero to ułatwia.
Czym jest analiza planogramów?
Analityka planogramów to proces wykorzystywania danych i wskaźników wydajności do oceny skuteczności planogramów w sklepie. Pomaga sprzedawcom detalicznym odpowiedzieć na ważne pytania, takie jak
Czy towary wysokomarżowe są wystarczająco widoczne?
Czy półki są zgodne z oryginalnym planogramem?
Czy ekspozycje oparte na planogramie zwiększają sprzedaż?
Łącząc dane dotyczące sprzedaży, zgodność ekspozycji i planogramów w sklepach, sprzedawcy detaliczni uzyskują pełny obraz tego, które towary na półce sprzedają się najlepiej, a które nie.
Dlaczego potrzebna jest analiza planogramów
Wdrożenie planogramu bez śledzenia jego wpływu jest jak uruchomienie kampanii marketingowej bez sprawdzenia jej wyników. Właśnie dlatego analityka jest kluczowa:
- Zwiększenie wydajności sprzedaży: Zidentyfikuj towary i lokalizacje na półkach, które osiągają słabe wyniki. Zmierz, które towary i lokalizacje generują największe dochody.
- Optymalizacja miejsca na półkach: Przydzielaj miejsce w oparciu o wydajność produktu, a nie tylko normy kategorii.
- Rozpoznawanie problemów ze zgodnością z planogramami: Śledź zgodność ekspozycji sklepów z planogramami. Identyfikuj sklepy, które nie wykonują planogramów prawidłowo.
- Decyzje oparte na danych: Wykorzystuj rzeczywiste dane, aby kierować strategiami merchandisingu wizualnego.
Kluczowe wskaźniki do śledzenia skuteczności planogramów
Sprzedaż według półek - Zrozum, w jaki sposób każda półka lub obszar wpływa na sprzedaż
Sprzedaż według SKU - Zmierz, w jaki sposób najbardziej widoczne lokalizacje zwiększają dochody ze sprzedaży określonych towarów.
Zgodność z planogramem - Śledź realizację i przestrzeganie przez sklep zaplanowanych layoutów.
Dostępność towaru - Identyfikuj braki magazynowe spowodowane problemami z ekspozycją lub uzupełnianiem zapasów.
Wydajność towaru według segmentów - Analizuj, które kategorie lub towary sprzedają się najlepiej na określonych ekspozycjach.
Wskaźnik realizacji zadań - Sprawdź, czy zadania merchandisingowe zostały wykonane na czas w każdym sklepie
Jak PlanoHero pomaga analizować wydajność półek za pomocą danych
Zrozumienie, jak produkty działają na półce, wykracza poza zwykłe tworzenie planogramów. Aby naprawdę poprawić merchandising, sprzedawcy detaliczni muszą śledzić, jak działają ekspozycje i jak one wpływają na sprzedaż, zapasy i wydajność przestrzeni. Dzięki narzędziom takim jak PlanoHero można analizować cały cykl wydajności półki - od planogramu do wdrożenia w sklepie i wyników.
Monitorowanie realizacji planogramów
Jednym z pierwszych kroków w analizie półek jest potwierdzenie, że planogramy zostały prawidłowo zrealizowane w sklepach. Można to zrobić za pomocą fotoraportów wysyłanych z poszczególnych lokalizacji. Śledzenie realizacji pomaga zapewnić spójność w sieciach handlowych i ułatwia identyfikację błędów, zanim wpłyną one na sprzedaż.
Analiza sprzedaży i wydajności powierzchni
Po wdrożeniu planogramu wydajność można mierzyć za pomocą różnych wskaźników sprzedaży detalicznej. Obejmują one:
- Obrót i zysk według produktu, kategorii lub półki
- Sprzedaż na metr bieżący lub kwadratowy półki lub powierzchni handlowej
- Dochód na metr wyposażenia lub witryny
- Zmiana sprzedaży lub dochodu w czasie
- Dostępność towarów na koniec okresu
Wskaźniki te pokazują nie tylko, jakie produkty są sprzedawane, ale także jak efektywnie wykorzystywana jest przestrzeń, co jest kluczowym czynnikiem zwiększającym rentowność na metr kwadratowy.
Porównywanie efektywności różnych sklepów
Sprzedawcy detaliczni, którzy prowadzą wiele sklepów, mogą korzystać z analizy porównawczej, aby zrozumieć, które sklepy radzą sobie gorzej, a które lepiej - i dlaczego. „ Analiza sprzedaży sieciowej” porównuje kluczowe wskaźniki, takie jak obroty, dochody i zapasy między różnymi sklepami, podkreślając potencjalne problemy z harmonogramem lub zapasami specyficzne dla każdego sklepu.
Ułatwia to dostosowanie planogramów lub strategii merchandisingowych do lokalnych zachowań zakupowych.
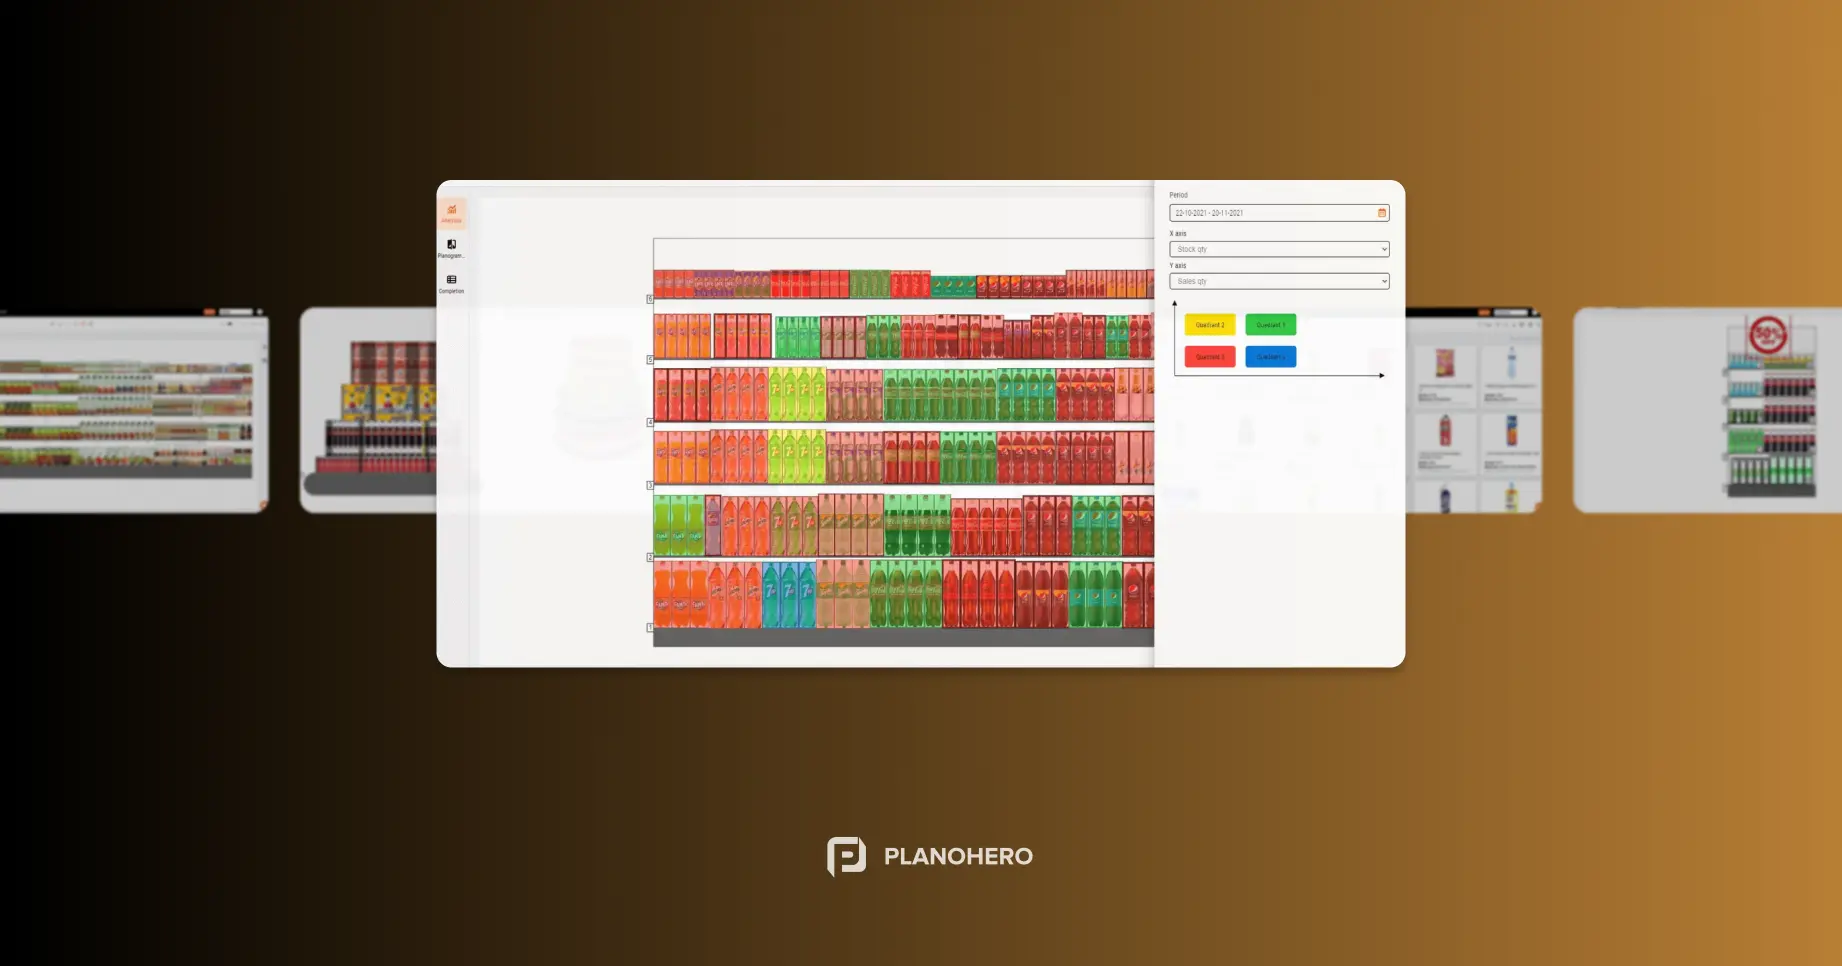
Wizualizacja ekspozycji produktów i zapełnienia półek
Narzędzia takie jak PlanoHero umożliwiają również sprzedawcom detalicznym wizualizację stopnia zapełnienia każdej półki. Detaliści mogą filtrować sprzedaż według grupy towarów, kategorii, marki lub dostawcy, aby zidentyfikować wzorce.
Ponadto sprzedawcy detaliczni mogą oszacować udział w ekspozycji - to znaczy, jaki procent półki lub wyposażenia zajmuje produkt, marka lub dostawca - i porównać go z częścią sprzedaży lub zysku generowanego przez te towary. Pomaga to ocenić, jak sprawiedliwie i efektywnie przydzielana jest przestrzeń na półkach.
Śledzenie zachowań klientów w sklepie
Niektóre narzędzia do raportowania zapewniają informacje na temat ruchu klientów w sklepie na podstawie danych dotyczących sprzedaży i liczby paragonów. Tworząc heatmapy odwiedzających, sprzedawcy detaliczni mogą określić, które półki przyciągają najwięcej uwagi, a które są pomijane.
Ten rodzaj analizy pomaga powiązać widoczność towaru z rzeczywistym zachowaniem klientów, co jest kluczowym elementem optymalizacji strategii ekspozycji.
Pomiar dokładności zapasów na półkach
Analiza zapasów na półkach pokazuje, na ile poziomy zapasów odpowiadają rzeczywistej sprzedaży. Pomaga zidentyfikować sytuacje, w których na półce znajduje się zbyt wiele lub zbyt mało towarów, wykorzystując takie wskaźniki, jak liczba dni, procent nadwyżki/niedoboru zapasów oraz średnia dzienna sprzedaż.
Wykrywając rozbieżności między zapasami na półkach a popytem, sprzedawcy detaliczni mogą precyzyjnie dostosować ilość towarów i uniknąć zarówno niedoborów, jak i nadmiernych zapasów.
Wniosek
Analiza wydajności półek to nie tylko analiza sprzedaży, ale także zrozumienie, w jaki sposób przestrzeń na półkach, poziomy zapasów i decyzje dotyczące ekspozycji wpływają na wyniki. Łącząc zgodność ekspozycji, dane dotyczące sprzedaży, śledzenie zapasów i dane dotyczące zachowań kupujących, sprzedawcy detaliczni mogą zoptymalizować każdy metr kwadratowy swojego sklepu.
Narzędzia do analityki planogramów zapewniają ustrukturyzowany sposób gromadzenia i interpretowania tych danych, pomagając zespołom merchandisingowym w podejmowaniu bardziej świadomych decyzji opartych na danych.
Szukasz oprogramowania tworzenia planogramów?
Wypróbuj bezpłatną wersję demonstracyjną PlanoHero