How to Increase Visibility, Sales & Shelf Efficiency in Beverage and Grocery Retail
Planograms are one of the most reliable tools for improving product discoverability and boosting revenue in food and beverage retail. When shelves are optimized, shoppers find what they want faster, promotions convert better, and high-performing products consistently stay in the spotlight.
For the food and beverage industry, well-designed planograms ensure:
- Higher product visibility for best-selling items.
- Strategic product placement (e.g., impulse buys at checkout).
- Improved sales performance through data-driven shelf arrangements.
Shelf Impact Stats
-
35–40% of purchase decisions are made directly at the shelf.
-
Eye-level placement increases sales by up to 45%.
-
Well-executed seasonal displays can lift category sales by 20–30%.
-
Cross-merchandising in beverages (e.g., snacks near drinks) boosts impulse buys by 15%.
Types of Planograms for Food & Beverage Retail
Planograms play a crucial role in optimizing product placement and enhancing the shopping experience in grocery stores, supermarkets, and convenience stores. Depending on store size, layout, and product type, retailers use different planogram formats to maximize sales and streamline inventory management. Below, we explore six major planogram types alongside additional specialized display formats commonly used in the food and beverage industry.
Revenue-Based Planogram (Market Share Placement)
Best for: Supermarkets, grocery stores, and high-traffic retail locations.
How it works: Products that generate the highest revenue are given prime shelf locations—usually at eye level or checkout counters.
Example: A best-selling soda brand placed at eye level in a beverage aisle.
Why it works: Ensures top-performing products are easily visible, leading to faster sales and higher profit margins.
Margin-Based Planogram
Best for: Small retailers, convenience stores, specialty markets
How it works: Products with higher profit margins are prioritized over lower-margin items, regardless of sales volume.
Example: Premium bottled water brands are displayed at checkout, even if they don’t outsell lower-priced alternatives.
Why it works: Helps retailers maximize profit per sale, making it a popular strategy for smaller businesses.
Brand Status Planogram (Commercial Status Placement)
Best for: Department stores, luxury grocery stores, high-end retailers
How it works: Premium and well-known brands are given priority shelf space over lesser-known brands.
Example: Starbucks bottled coffee is given more shelf space than generic coffee brands in convenience stores.
Why it works: Leverages brand recognition to drive customer trust and influence purchase decisions.
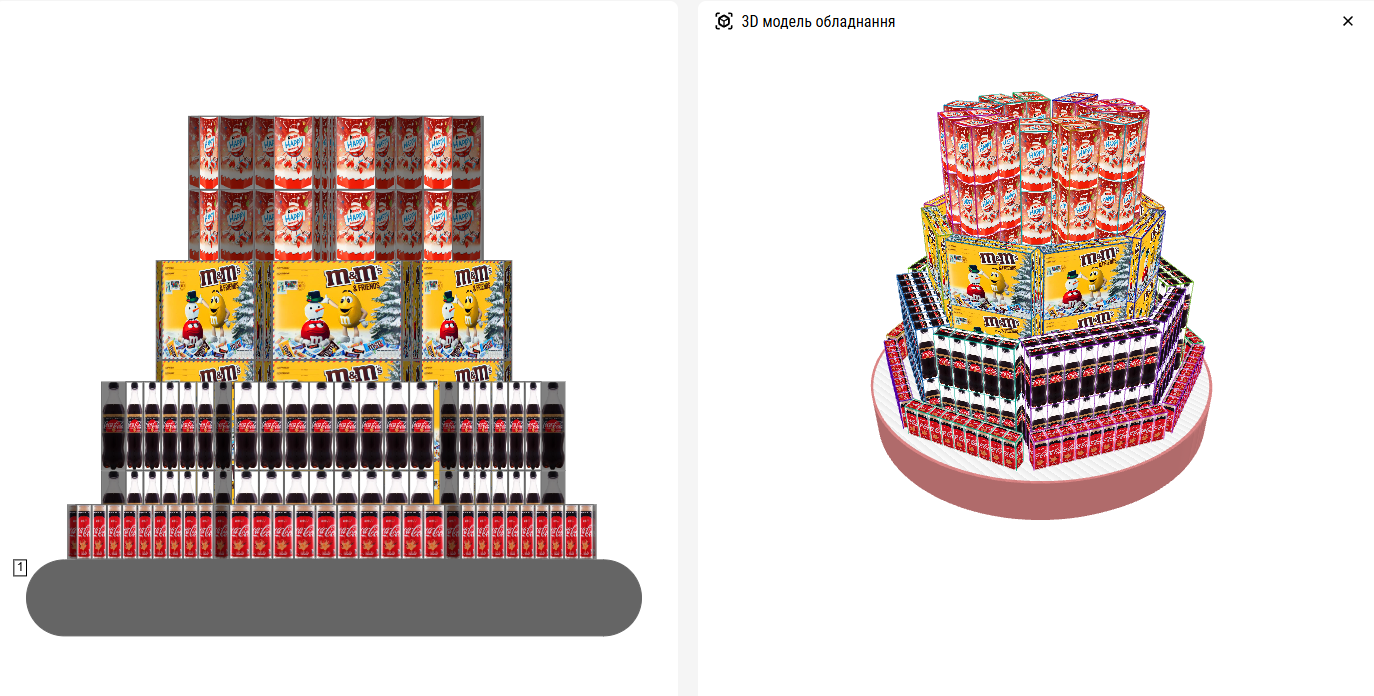
Block Placement Planogram
Best for: Discount stores, supermarkets, bulk retailers
How it works: Products are grouped by category rather than brand or margin.
Example: All breakfast cereals are placed in one section, regardless of brand.
Why it works: Encourages comparison shopping, allowing customers to quickly evaluate options.
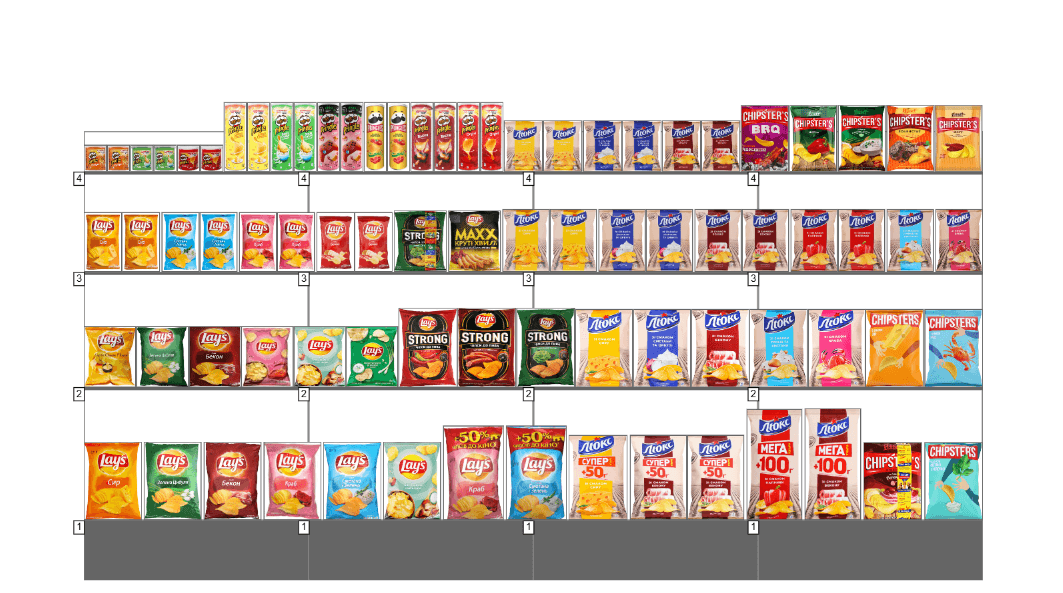
Horizontal Placement Planogram
Best for: Grocery store aisles, supermarkets
How it works: Products are arranged in horizontal rows at the same shelf level, making it easy for customers to scan across options.
Example: Different juice brands lined up at eye level in a beverage aisle.
Why it works: Enhances visibility and comparison shopping, especially for competitive product categories.
Vertical Placement Planogram
Best for: Beverage coolers, multi-tier shelving systems
How it works: Products are placed in a top-to-bottom arrangement, with premium or best-selling products at eye level.
Example: A grocery store beverage cooler where premium brands like Red Bull are at eye level, while budget sodas are placed lower.
Why it works: Guides customers through different price and brand tiers, smoothing product navigation.
Examples of Display Planograms for Food & Beverage Retail
In addition to standard planogramming strategies, retailers use specialized display formats to enhance promotions, seasonal sales, and customer engagement.
1. Seasonal Planogram
How it works: Adjusts shelf layouts based on holidays, special events, or seasonal shopping trends.
Example: Pumpkin spice-flavored drinks and snacks prominently displayed in the fall.
Benefit: Boosts seasonal sales by aligning with customer demand.
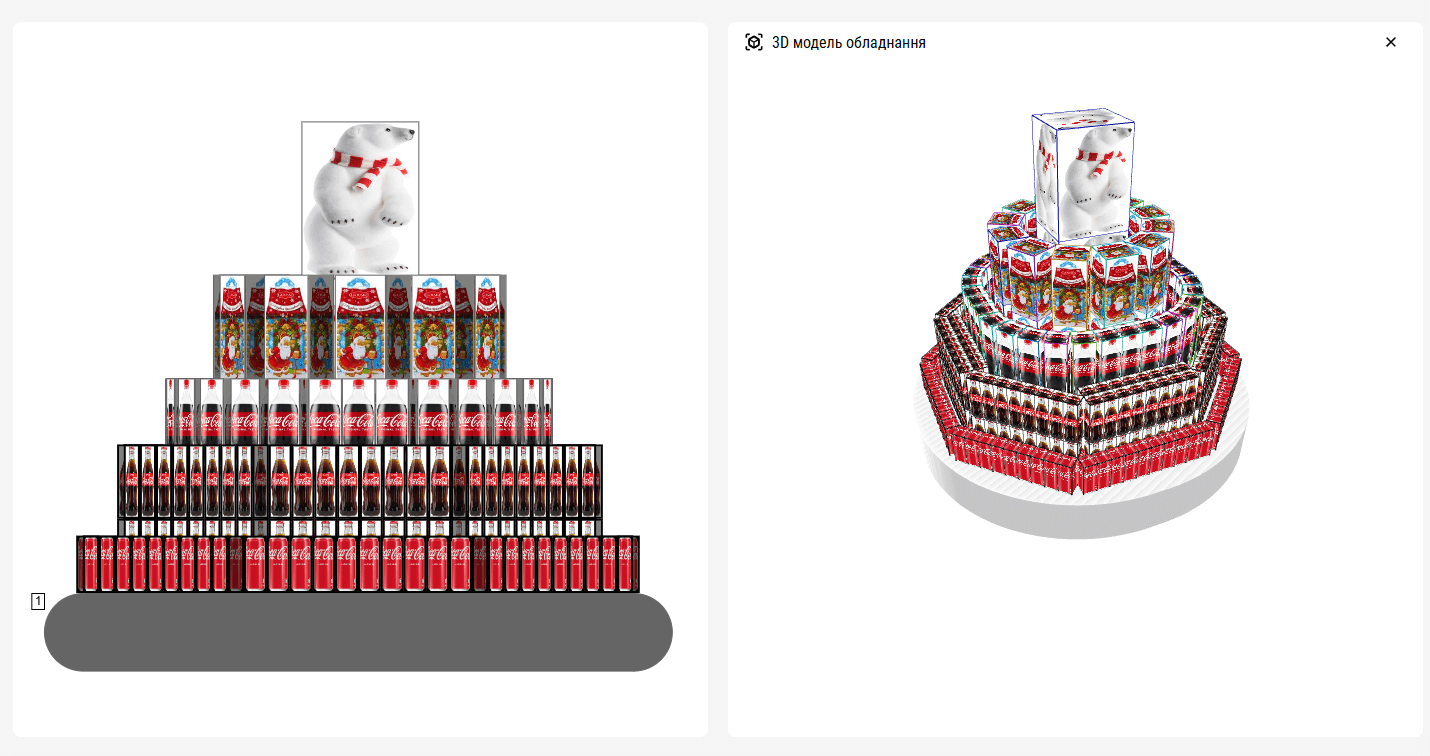
2. Promotional Planogram
How it works: Highlights products on sale or promotion with eye-catching displays.
Example: A soft drink display near checkout promoting a "Buy 2, Get 1 Free" deal.
Benefit: Increases impulse purchases and encourages bulk buying.
3. Micro Space Planogram
How it works: Optimizes small, high-visibility spaces like end caps, checkout areas, or island displays.
Example: A standalone snack display at the entrance of a convenience store.
Benefit: Maximizes limited shelf space for high-margin or impulse-buy products.
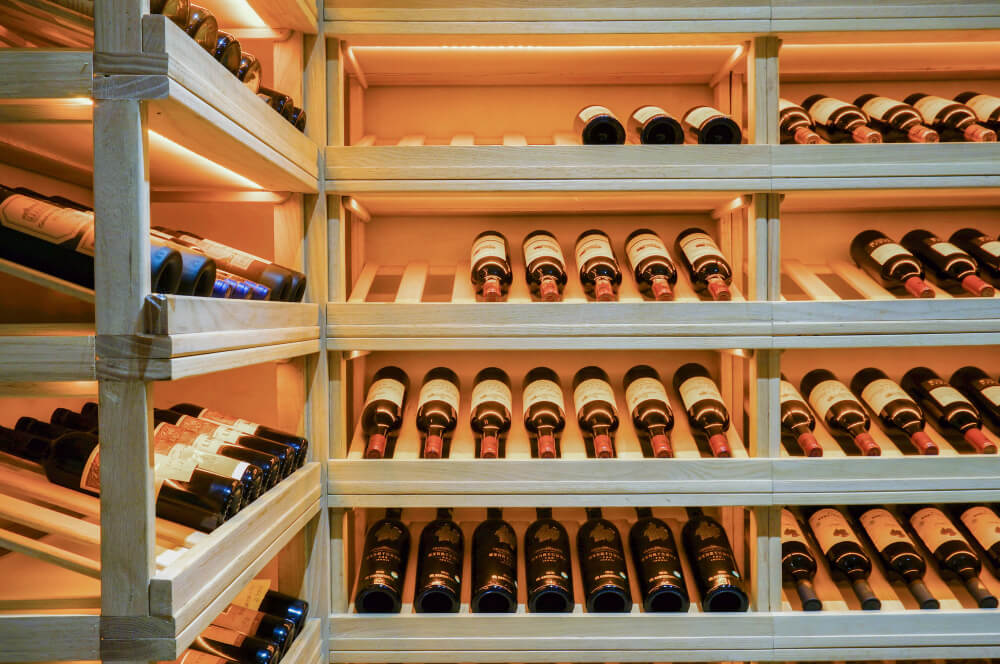
4. Visual Merchandising Planogram
How it works: Focuses on aesthetic presentation, using color coordination, lighting, and signage to attract customers.
Example: A wine display arranged by bottle color to create an eye-catching gradient.
Benefit: Enhances the overall shopping experience, making stores more visually appealing.
5. Experimental Planogram
How it works: Creates interactive displays encouraging customers to engage with products before purchasing.
Example: A coffee brand's tasting station with free samples and a mini display of related products.
Benefit: Increases customer engagement and helps drive brand loyalty.
Choosing the Right Planogram Strategy
Retailers should choose their planogram strategy based on key business objectives:
- Maximizing sales? → Use Revenue-Based or Margin-Based Planograms.
- Encouraging brand trust? → Brand Status Planograms help highlight top brands.
- Creating an organized shopping experience? → Block or Horizontal Placement Planograms ensure a structured layout.
- Running promotions or seasonal campaigns? → Promotional and Seasonal Planograms are ideal.
Pro Tip: The best results come from combining multiple planogram strategies and adjusting based on sales data and customer feedback.
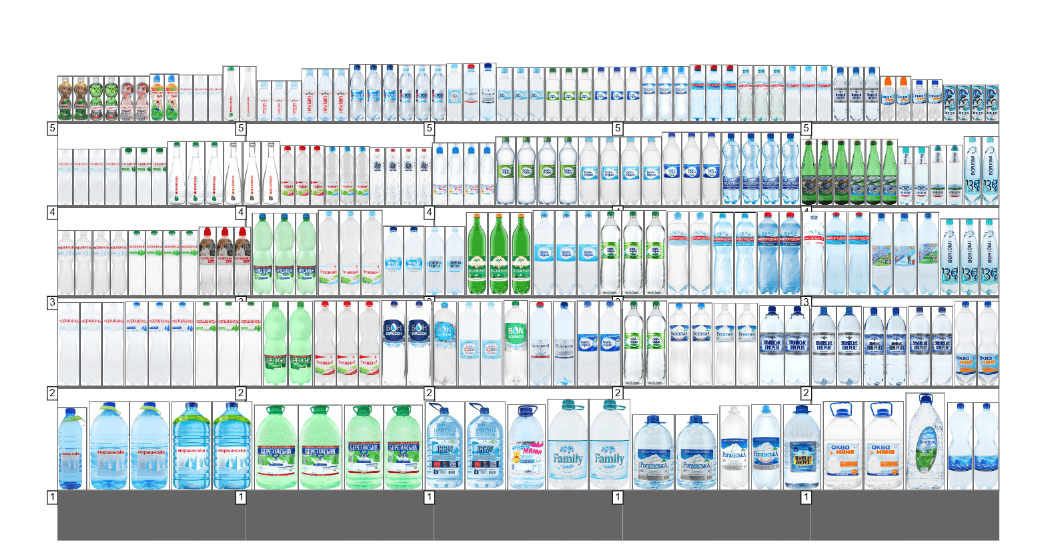
How to Optimize Beverage Shelves
Step-by-Step Guide for an Effective Beverage Planogram
Step 1: Categorize Beverages
Group drinks into categories: carbonated sodas, energy drinks, bottled water, juices, and alcoholic beverages.
Step 2: Identify Best-Selling Products
Use sales data to determine which products should be placed at eye level for higher visibility.
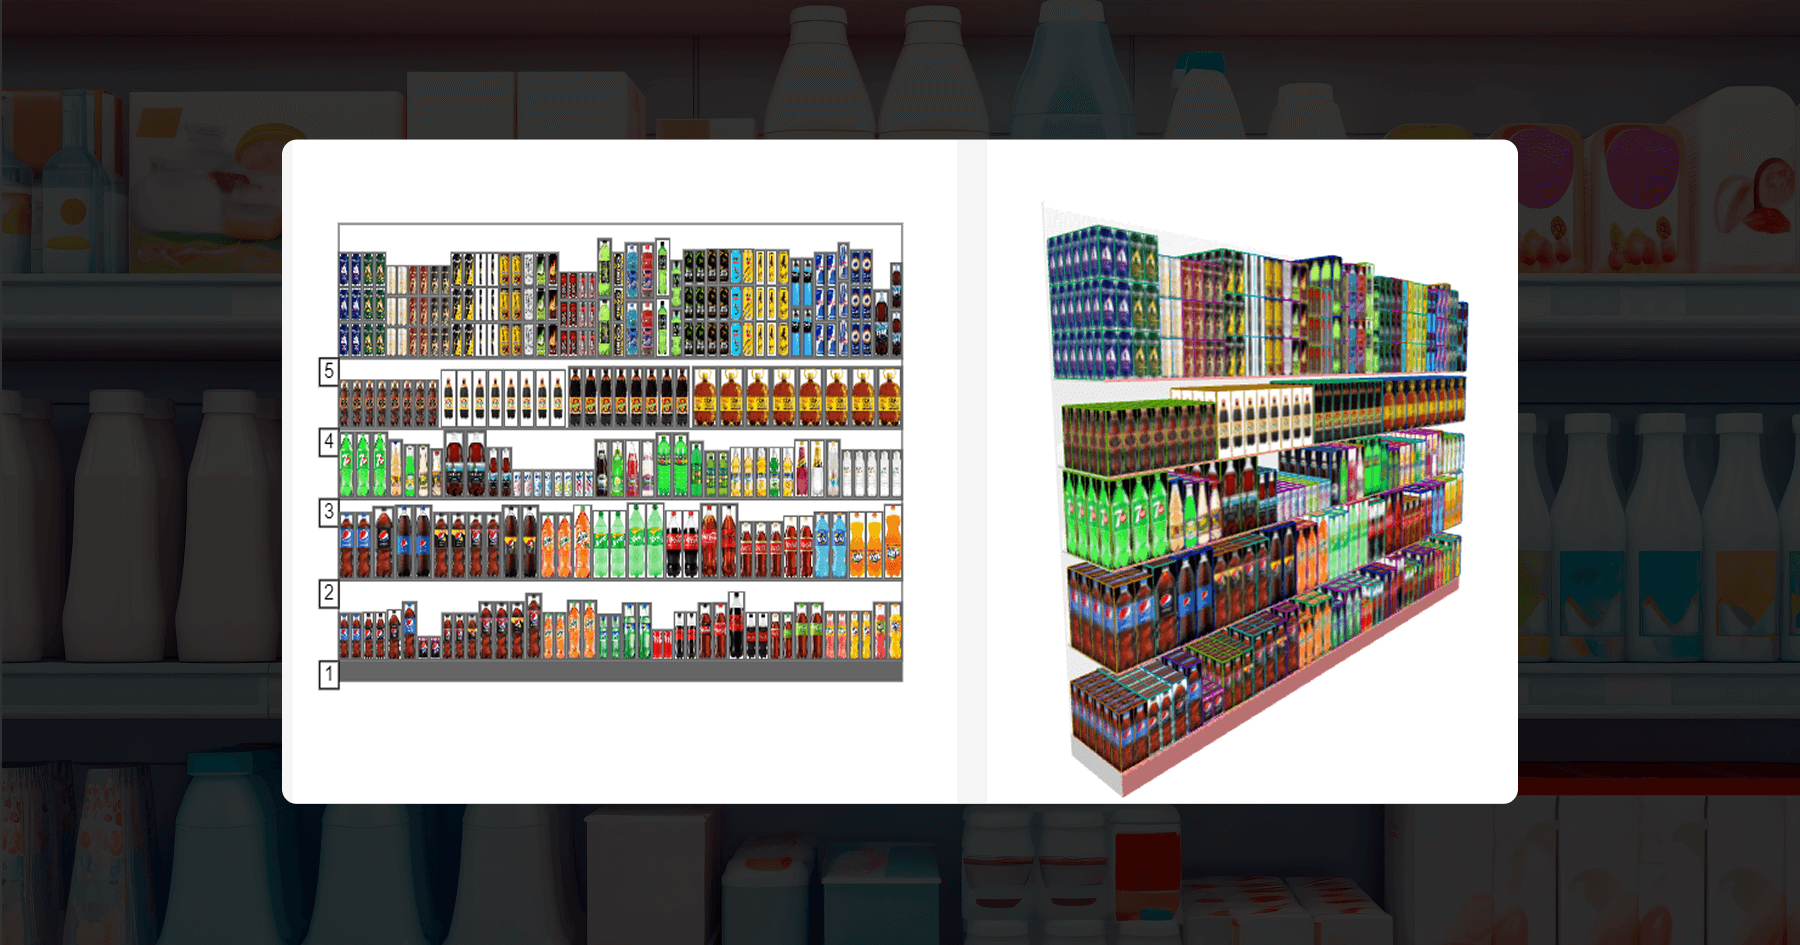
Step 3: Implement the Right Planogram Type
- Vertical stacking for soft drinks.
- Brand blocking for energy drinks.
- Price-tiered approach for water and premium beverages.
Step 4: Use Impulse Buy Strategy
Place grab-and-go drinks near checkout areas to increase last-minute purchases.
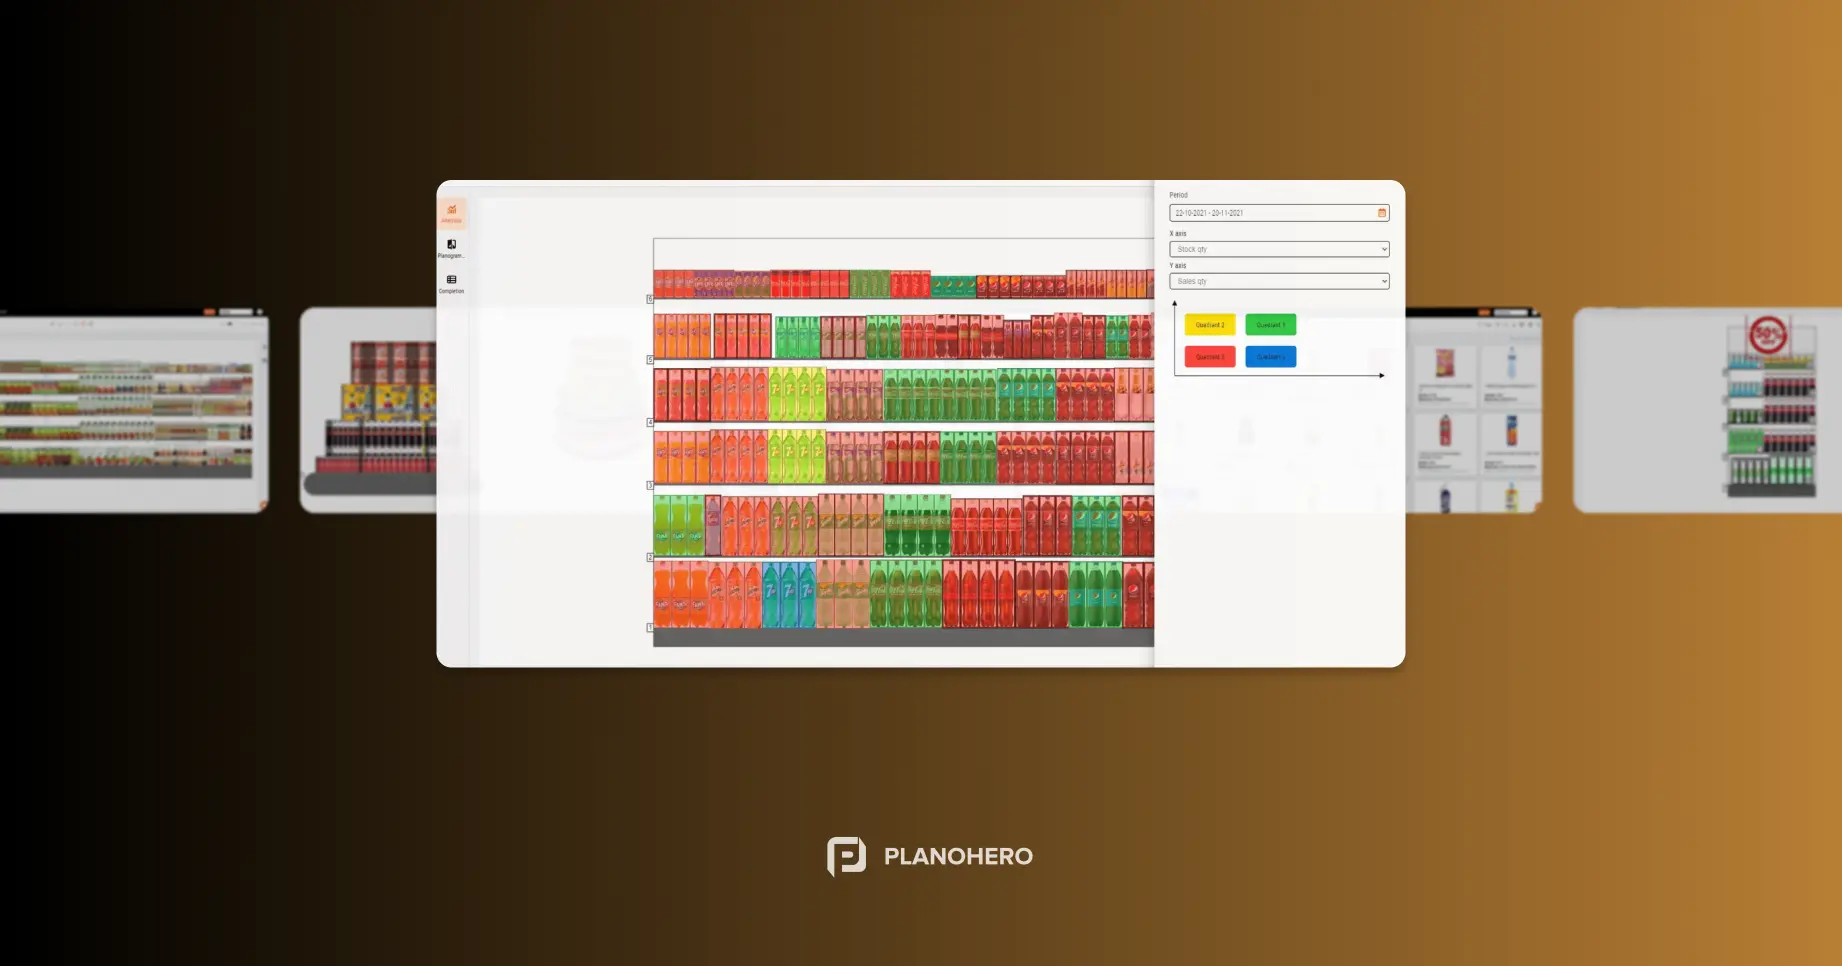
Step 5: Track and Optimize
Use retail analytics to adjust shelf arrangements based on sales performance.
Best Practices for Food & Beverage Planograms
Prioritize Eye-Level Placement: Best-selling and high-margin products should always be at eye level.
Use Data for Shelf Optimization: Adjust planograms based on sales reports and customer buying behavior.
Maintain Brand Consistency: Ensure brands have a uniform presence across multiple stores.
Encourage Impulse Purchases: Position small beverage cans, chocolate bars, or gum near checkout lanes.
Optimize Space for Seasonal Products: Rotate shelf space for limited-time or seasonal beverage promotions.
Planogram Tips for Beverage Sales & Merchandising
Use Multiple Display Types – Beverages require refrigerators, coolers, shelves, and freestanding displays. Additional setups like counter displays, wing panels, and cross-merchandising units enhance visibility. Retailers should also consider bottling formats, closure methods, and shelf life (e.g., soft drinks degrading after 90 days).
Organize by Category – Group beverages like soft drinks, beer, wine, and cider to simplify shopping. Sorting by brand and price can influence buying decisions.
Feature New Products Weekly – Highlighting a new wine or soft drink every week attracts attention and encourages impulse purchases.
Create Scarcity & Promote Discounts – Leaving a few shelf spaces empty makes products appear in high demand, subtly influencing sales. Adding discount labels or promotional offers further drives in-store purchases.
How Much Does Planogram Software Cost? (And Why It Matters)
The cost of planogram software varies widely based on features, number of users, automation level, and whether it includes store execution tools and analytics. Entry-level tools may start around $50–$100 per user/month, while more advanced solutions with automation, store-to-HQ communication, and analytics can range from $500–$1500+ per month for larger retail teams.
When evaluating planogram software, look for value—not just the price tag. Tools like PlanoHero offer an affordable, scalable option designed specifically for food & beverage retailers. It includes planogram creation, store communication, shelf analytics, and performance tracking—helping retailers avoid costly manual work and improve shelf efficiency without overspending. See PlanoHero Pricing
If you're comparing solutions, consider:
- ease of implementation
- automation level
- store execution tools
- reporting & analytics
- ability to manage multiple stores or clusters
A well-chosen planogram tool often pays for itself quickly through improved shelf accuracy and increased sales.
FAQ: Planograms in the Food & Beverage Industry
1. What is a planogram?
A planogram is a visual diagram that shows where and how products should be placed on store shelves to maximize visibility, sales, and customer experience.
2. Do small stores really need planograms?
Yes. Even small-format stores benefit from structured product placement, especially for high-margin and impulse items.
3. How often should planograms be updated?
Most retailers update shelves monthly, while high-turnover categories like beverages may refresh weekly or bi-weekly.
4. What data should I use to build a planogram?
Sales data, product velocity, profit margins, seasonality, and customer behavior patterns.
5. How can planogram software help?
Planogram software automates layout creation, ensures consistency across stores, streamlines communication with store staff, and provides analytics for continuous optimization.
6. Is planogram software expensive?
Costs vary, but many retailers find that the increased sales and reduced labor more than justify the investment. Platforms like PlanoHero offer cost-effective options for teams of any size.
7. Can planograms boost impulse purchases?
Absolutely—placing drinks, snacks, and grab-and-go items near checkout or high-traffic zones increases unplanned buys.
8. What planogram type works best for beverages?
A mix of vertical placement, brand blocking, and price-tiered layouts gives the best results for beverage categories.
Looking for a service to create planograms?
Try a free demo version of PlanoHero