
Last updated: August 25, 2026
Merchandising analysis is the process of collecting and analyzing sales, inventory, and in-store behavior data to evaluate how effectively products are displayed, priced, and stocked across a retail chain. It is often used interchangeably with the term retail merchandising analytics, which describes the broader discipline of tools and metrics retailers use to run this kind of analysis — turnover, sell-through, shelf space, and customer traffic data all fall under this umbrella.
Sales analytics helps analyze in-store merchandising and generate insights using the data. This analysis allows retailers to make data-driven decisions for effective merchandising strategies and increasing profit.
What Are the Core Types of Retail Merchandising Analytics?
Retail merchandising analytics is not a single metric — it's a set of related analysis types that, together, give a full picture of in-store performance:
- Sales & Turnover Analytics — profit, turnover, number of transactions, sales, and sales per square foot, used to benchmark day-to-day performance.
- Customer Traffic Analytics — heat maps and foot-traffic data that show hot and cold zones in a store's sales area.
- Planogram & Shelf Analytics — facing counts, planogram compliance, lost sales from out-of-stock items, and overstock/shortage tracking.
- ABC / Assortment Analytics — classification of SKUs by contribution to revenue (based on the Pareto principle), used to guide assortment and category decisions.
A customized merchandising process lets a retailer combine these analysis types and make decisions based on the results, rather than relying on one metric in isolation.
Key Merchandising Analysis KPIs
| KPI | What It Measures | Formula |
|---|---|---|
| Sell-through rate | Share of received inventory that's sold | Units sold ÷ units received × 100 |
| Sales per square foot | Space productivity | Total sales ÷ selling area |
| GMROI | Return on inventory investment | Gross margin ÷ average inventory cost |
| Stockout rate | Product availability | Out-of-stock SKUs ÷ total SKUs × 100 |
| Planogram compliance | Execution accuracy | Correctly executed elements ÷ total elements × 100 |
For a broader list of merchandising and planogram KPIs — including revenue, conversion rate, and shopper-behavior metrics — see our Retail Merchandising KPIs guide.
Manage Shelf Space with Retail Merchandising Analytics
The right merchandising with the right items on the shelves helps chains avoid lost sales. Thanks to analytics, retailers quickly learn how items are sold in stores, the demand, and how much inventory they have in store. This information helps generate orders quickly and avoid empty shelves.
Merchandising analysis helps brands and suppliers track their sales at each store and convince retailers to give them more shelf space. Understanding how consumers perceive the brand and understand the product also helps improve brand positioning.
With merchandising analysis, chains can identify problems in the assortment in time and seize opportunities to improve the in-store layout.
How do you know your merchandising is effective?
Sales are the best benchmarks. The leading indicators are profit, turnover, number of checks, sales, and sales per square foot of sales area. A customized merchandising process allows you to analyze the process and make decisions based on the analysis results.
Tools for merchandising automation help retail chains manage all processes from creating store plans and planograms to shelf control and analysis. The functionality of the PlanoHero service allows you to track analytics in the context of store plans, planograms, and summarized analyses for the entire retail chain.
Store Plan and Planogram Analytics
By analyzing the metrics in a store plan, retailers can quickly track the sales performance of the entire store and each planogram over time. Modern merchandising software typically offers analytics on key metrics — turnover, number of checks, sales, profit, and stock balances — along with heat maps that show customer traffic across the sales area (hot and cold zones of the store).
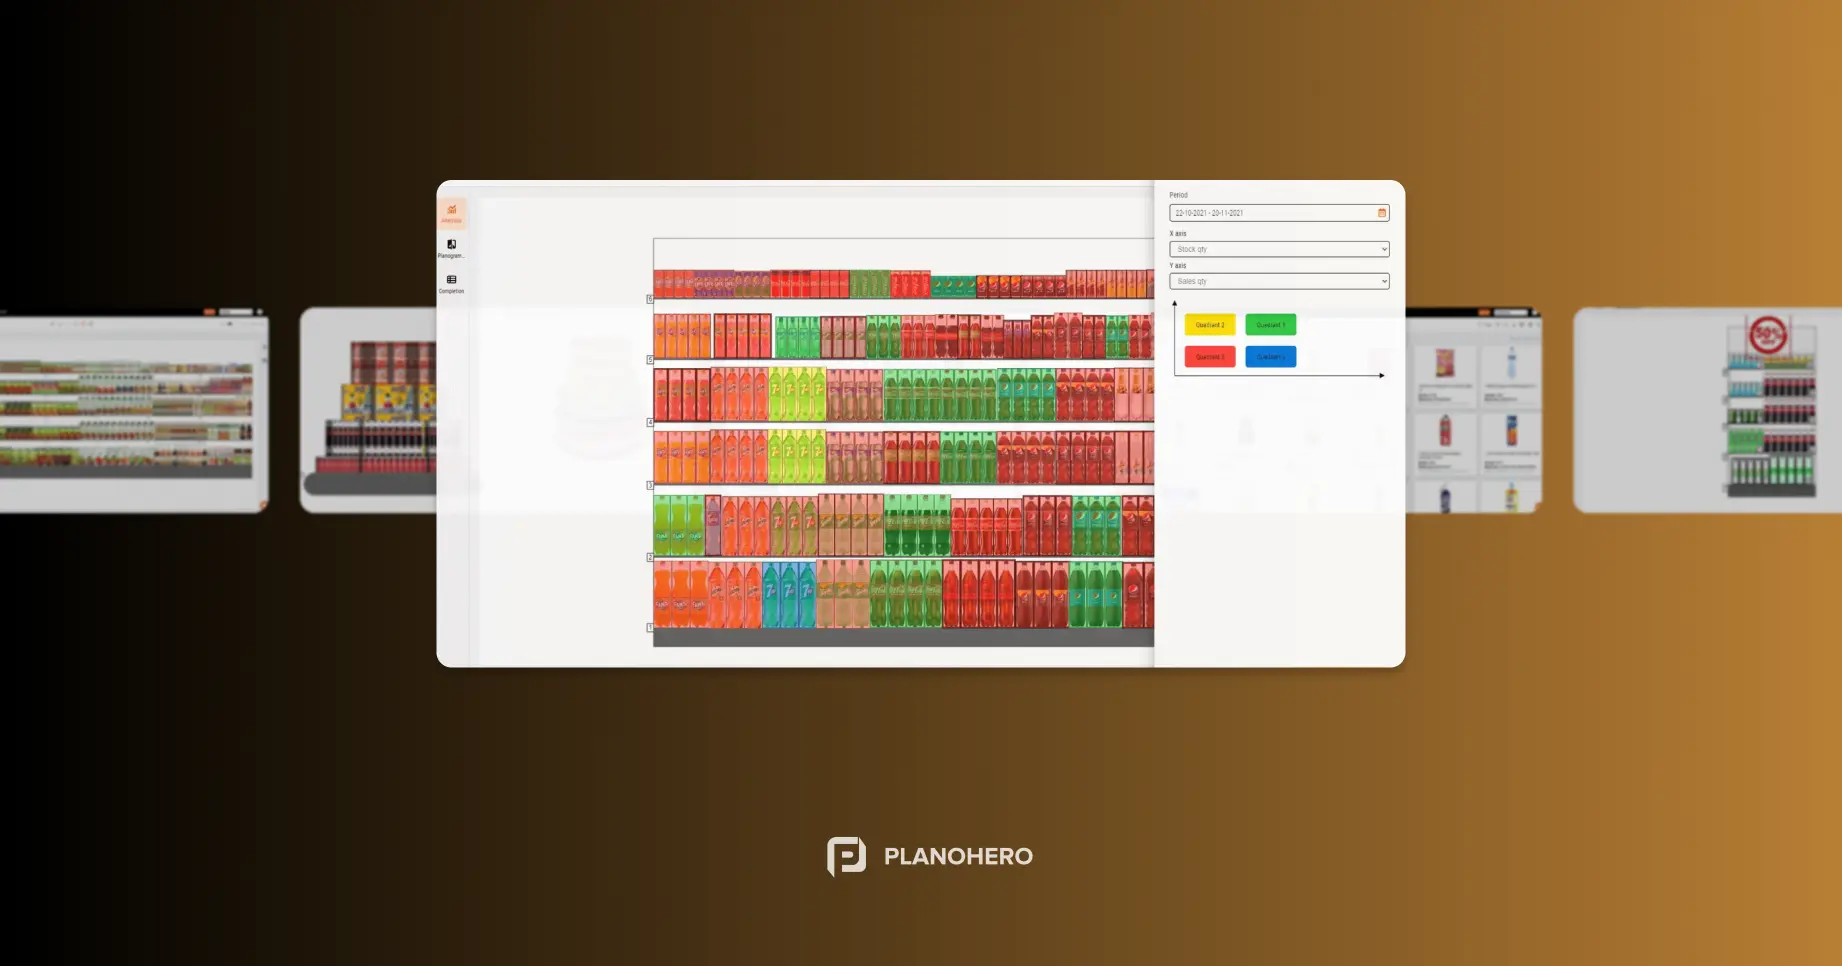
At the planogram level, the same tools report lost sales when products are unavailable, ABC analysis (by turnover, profit, number of sales, and number of checks), overstock, shortage of goods, and planogram compliance — how closely a store's actual shelf layout matches the approved plan.
ABC analysis is based on the Pareto principle, also called the 80/20 rule: roughly 80% of a store's revenue comes from just 20% of the products. ABC analysis makes it possible to identify the most profitable 20% of a store's assortment, whether analyzing product groups, categories, specific brands, or suppliers.
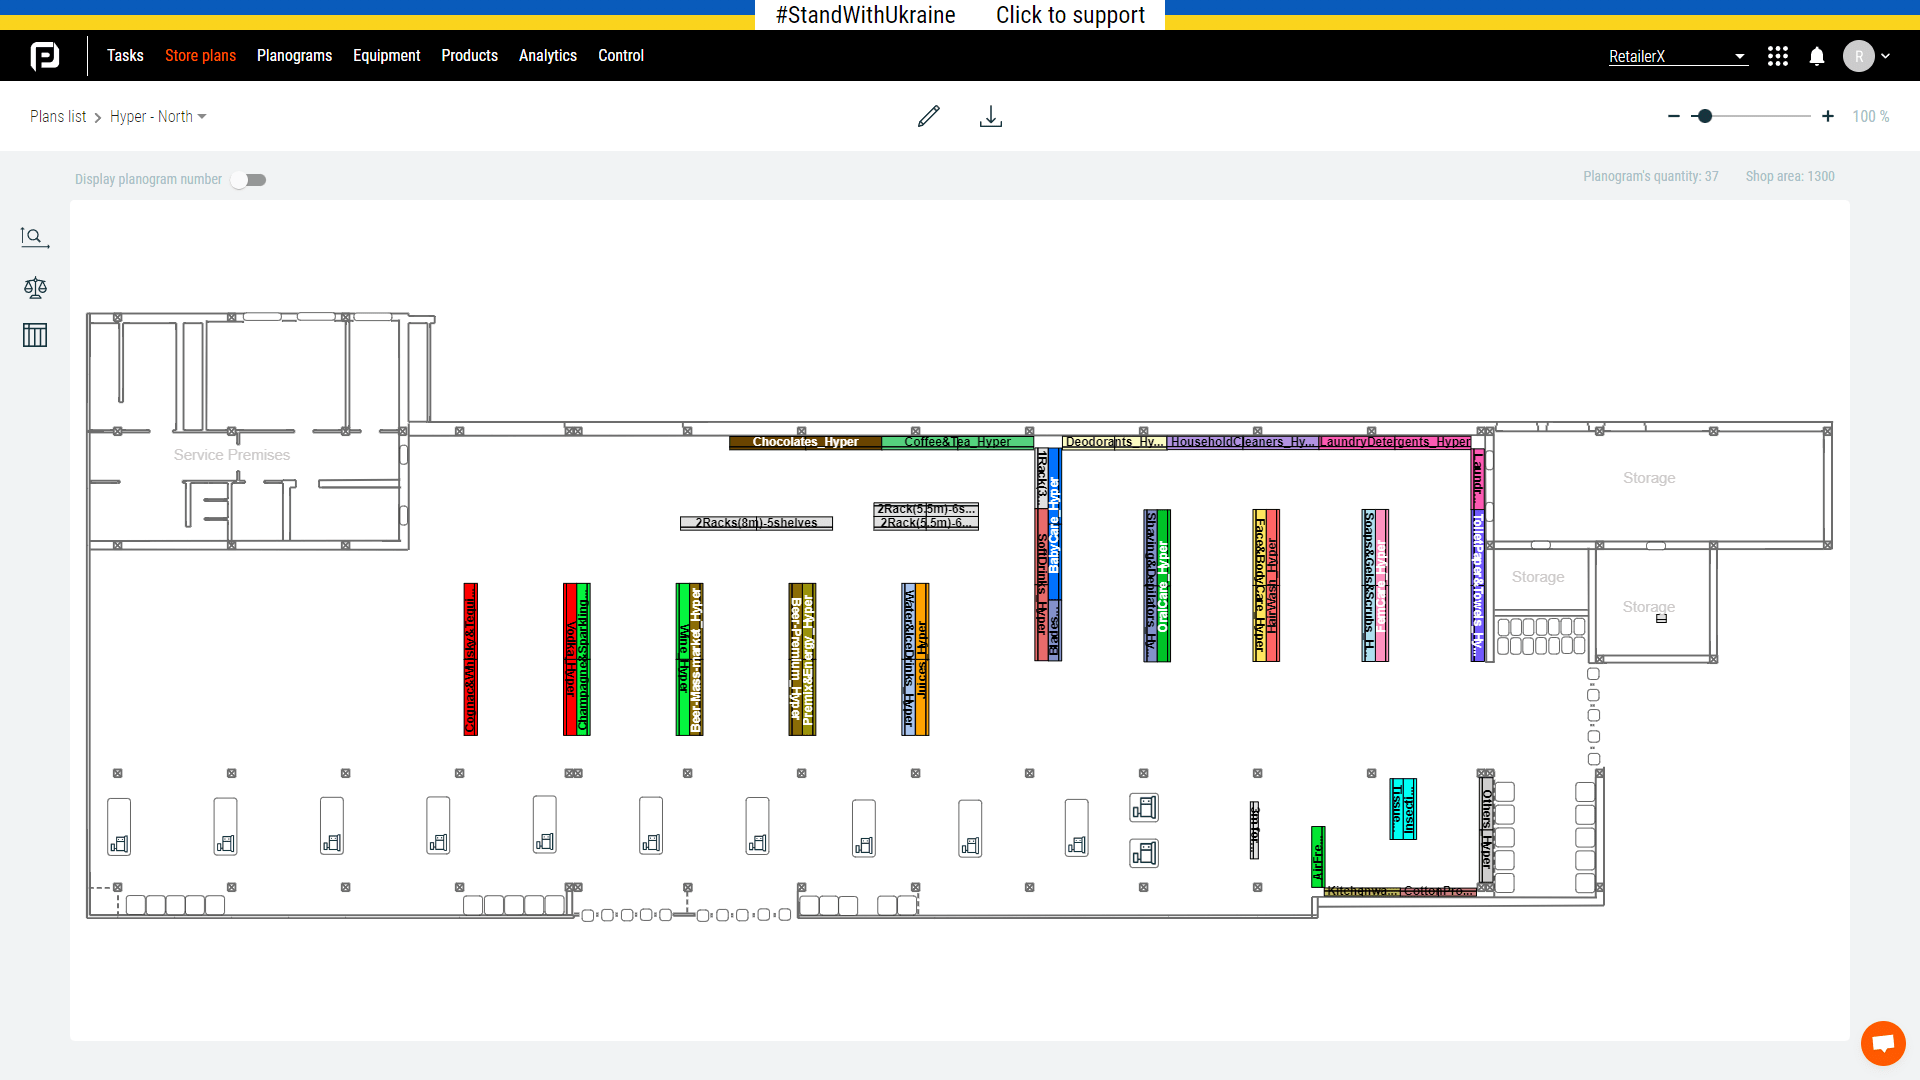
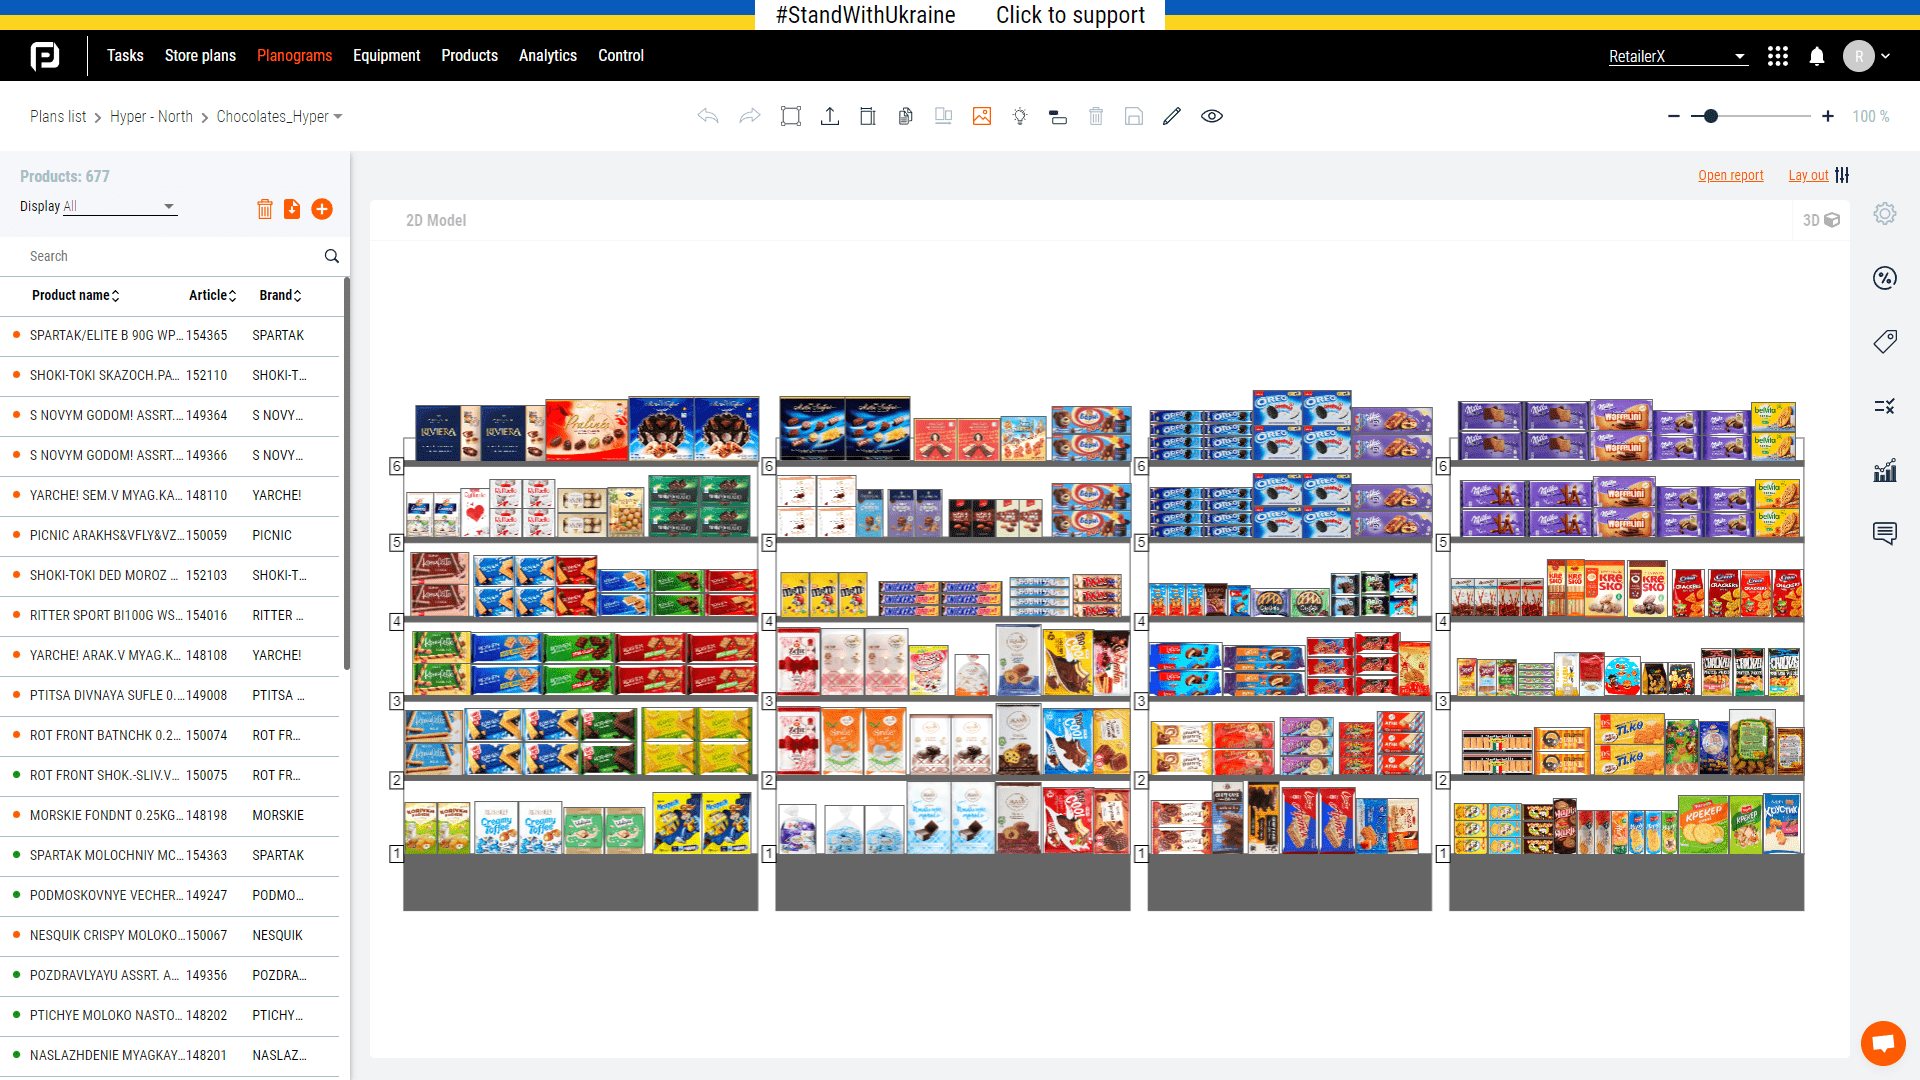
This information helps retail chains make decisions about assortment changes and build layouts based on data rather than guesswork. It also allows access to consolidated product sales analytics across the entire store chain — comparing total and per-store sales to evaluate the main indicators of effectiveness for each location.
Processes need to be analyzed continuously and with a systematic, integrated approach — otherwise it becomes difficult to compare current data with previous periods.
Analysis of Customer Traffic in the Sales Area
Analysis of the store floor plan's efficiency shows problem areas and promising zones. Heat maps help quickly assess the situation in a store at different times of day.
Identifying "hot" and "cold" zones lets retailers determine popular products and high customer traffic locations in the sales area. This is an opportunity to respond quickly to inefficient use of floor space, optimize product assortment, select related products for cross-merchandising in each store zone, and evaluate the effectiveness of promotions and seasonal or holiday sales.
How to Conduct Merchandising Analysis: 5 Steps
A structured approach keeps merchandising analysis from turning into an endless spreadsheet review. Five steps cover the full cycle:
- Measure. Pull sales, margin, stock, space, and traffic data from POS systems, planogram software, and in-store sensors or heat maps.
- Diagnose. Find underperforming SKUs, shelves, and store zones using the KPIs above (sell-through, sales per square foot, stockout rate, planogram compliance).
- Prioritize. Rank the opportunities found by expected business impact — not every underperforming shelf needs immediate action.
- Act. Change the assortment, facings, or planogram based on the highest-priority findings.
- Validate. Compare results before and after implementation, then repeat the cycle — merchandising analysis works best as a continuous process, not a one-off project.
Merchandising Analysis vs. Merchandising Audit
The two terms are related but not identical. Merchandising analysis is data-driven — it works with sales, turnover, and traffic numbers to understand what is happening and why. A merchandising audit (or visual merchandising audit) is more observational — a field team or manager physically checks that displays, signage, and planogram execution match brand standards in-store. In practice, the two work together: audits confirm that a planogram is executed correctly on the shelf, while merchandising analysis measures whether that execution is actually driving sales.
From Manual Tracking to AI-Assisted Merchandising Analysis
Merchandising analysis used to mean manually cross-checking spreadsheets against store visits, with insights arriving weeks after the fact. Many retail merchandising teams still rely on disconnected data sources and manual spreadsheet workflows, which can delay analysis and decision-making. Retailers are increasingly moving toward connected, near-real-time data and AI-assisted tools that can flag compliance issues, forecast demand, and suggest layout adjustments automatically — reducing the lag between a problem appearing on the shelf and a decision being made about it. PlanoHero's AI-powered merchandising tools are built for exactly this shift — helping retailers spot compliance gaps and layout opportunities without waiting for a manual review cycle.
Why Retail Chains Need Merchandising Analysis
Retail merchandising analysis helps chains make data-driven decisions, grow revenue, increase customer loyalty, and stay ahead of the competition. It's difficult for large chains to manage assortment and layout decisions without it — analytics let retailers predict new displays and sales trends and adapt processes to increase sales and improve customer satisfaction.
FAQ
What is merchandising analysis?
Merchandising analysis is the process of collecting and analyzing sales, inventory, and traffic data to evaluate how effectively products are displayed and stocked in a store, and to guide decisions about layout and assortment.
What is the difference between merchandising analysis and retail merchandising analytics?
The terms are largely interchangeable. "Merchandising analysis" usually refers to the process of evaluating performance, while "retail merchandising analytics" refers more broadly to the discipline, metrics, and tools used to run that process.
What data is needed for merchandising analysis?
At minimum, merchandising analysis needs POS sales data (units, revenue, checks), inventory/stock data, and planogram or shelf-layout data. Adding customer traffic data (heat maps, foot traffic) and pricing/promotion history makes the analysis more complete, since it connects what's on the shelf to how shoppers actually move through the store.
How often should retailers run merchandising analysis?
Merchandising analysis works best as a continuous, systematic process rather than a one-time project — most chains review key metrics monthly, with deeper category or planogram reviews on a quarterly or seasonal basis.
Looking for a service to create planograms?
Try a free demo version of PlanoHero