Physical store owners are working hard to attract more customers and increase revenue. One of the leading indicators of high sales is the store's high customer traffic (foot traffic). How many customers visit your physical store?
What is Customer Traffic?
Store traffic rate is the number of people visiting the store in a given period.
Customer traffic – information about the attendance and intensity of the customer movement for a certain period of time. By analyzing traffic data, you can calculate the conversion – the proportion of buyers who bought goods from the general flow of people who visited the store.
Pay attention to customer traffic before opening a store in a particular location. After all, with more traffic near the store, more potential buyers will visit the shop.
Heatmap of the Customer Traffic in Retail Store
You can determine the areas of the largest and smallest concentrations of customers on the trading floor. These are places that buyers visit more frequently and areas where customers rarely buy. These so-called in-store cold and hot zones form a heatmap of the customer movement. This map is available in the PlanoHero service.
Cold zones are places that customers ignore. The sales there are lower than the average for the store. Conversely, hot zones are places with the highest sales and turnover rates. In the PlanoHero service, you can get an analytical report on how customers move into the store at a particular time or day, for example, on Monday morning or Friday evening.
For instance, according to the foot traffic analysis, customers who bought bread also visited the dairy department. This way, you can determine how buyers move when buying a particular product.
How to Measure Retail Store Traffic?
The easiest way is to use meters, mobile surveillance technologies, heat sensors, or video surveillance. These tools count the number of shoppers and track customer behavior, waiting time, and other metrics.
Traffic information is critical to increasing sales and profits. When analyzing traffic, attention is paid to peak hours and days of maximum customer activity. Operating data, the retailer can prepare: make additional orders for top-selling items, take care of efficient layout and adjust working hours, and train staff so that more cashiers and shop assistants work during peak hours.
Sales tracking gives you insight into what products are in demand in your store. So, if product sales were low during peak hours, perhaps this product should be removed from the assortment, or you should consider discounts and promotions.
In large chain stores, electronic attendance tracking technologies are commonly used. So, data from cameras and touch sensors allow you to determine the store attendance rate.
According to statistics, in January 2022, overall store traffic decreased by almost 8% compared to January 2019. There is now a significant upgrade from the peak of the pandemic.
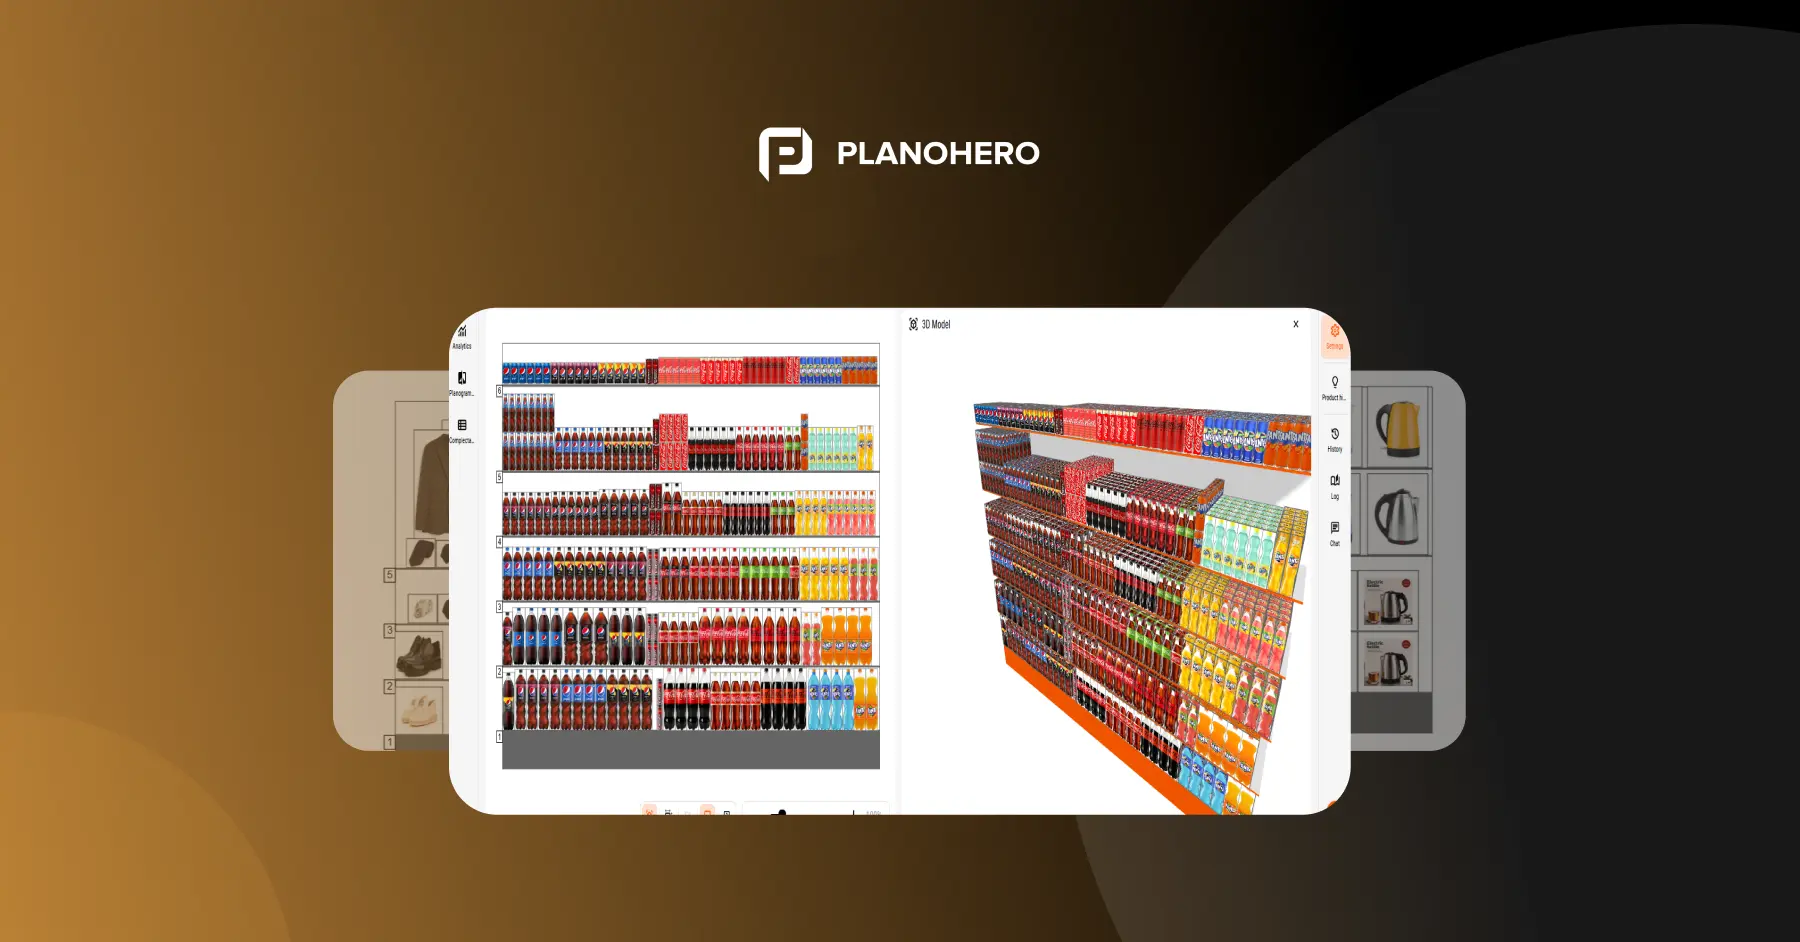
Analytical Report “Visitors Traffic” in the PlanoHero Planogram Software
Higher traffic – more sales
Meanwhile, traffic can increase due to promotions and discounts.
With the help of a heatmap in the PlanoHero service, you can track how traffic and sales in a store change after a promotion or the introduction of new products.
The analytical report “Visitors traffic” generates a heat map of the customer traffic on the trading floor. This report is generated based on checks for the selected period. Thus, it is possible to determine the features of the customers’ movement on the trading floor for a certain period and at a particular time.
On the store plan, you can see zones where goods are most often bought. Places on the heat map highlighted in red and yellow show the greatest concentration of people and the highest in-store sales, and in blue and green – are places where customers buy the least.
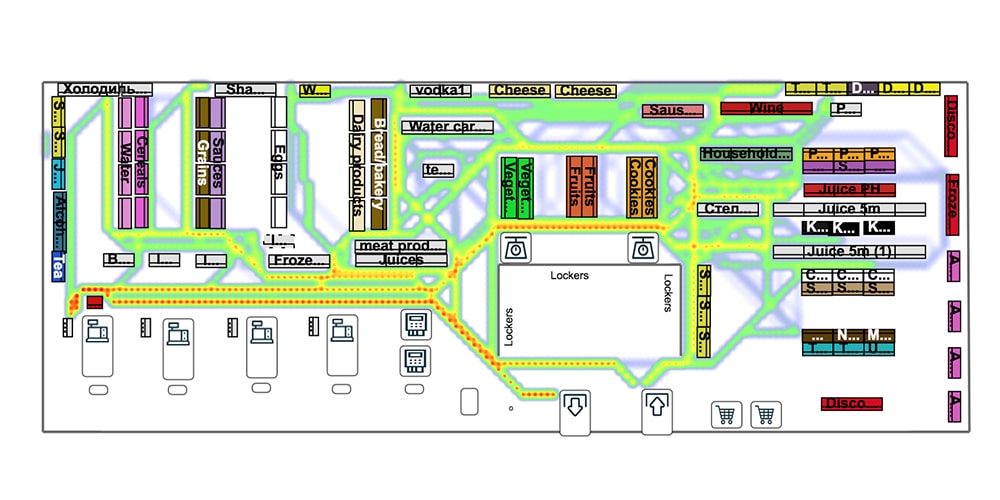
Customer traffic map in PlanoHero service
When you hover over the trading equipment on the map, you’ll see the number of checks and sales indicators for a certain period.
In the PlanoHero service, using a heat map, you can:
- monitor the customers' traffic in the store at different hours and days of the week;
- determine cold and hot zones of the trading floor;
- Analyze the places with the greatest and lowest sales, best-selling, and slow-moving goods.
Use a customer traffic heat map to understand the processes taking place in your store. Apply this knowledge to increase sales and customer retention.
With the customer traffic report, you can optimize space and increase sales through strategic product placement. It is also recommended that the range of goods in places with the heaviest visitor traffic be regularly updated. Measuring customer traffic will help forecast sales and avoid lost sales and stockouts, and vice versa.
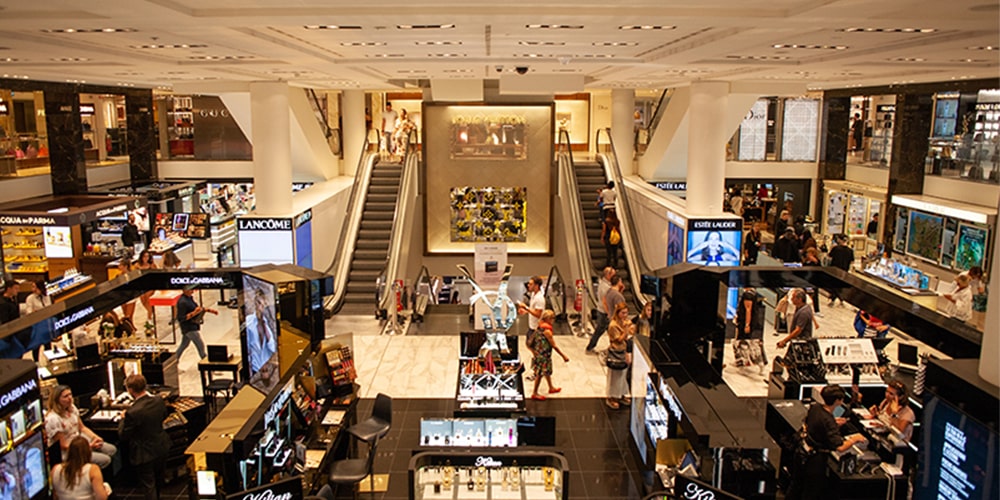
Omnichannel
Retailers are working to continually find new opportunities to encourage shoppers to return to stores. Combining the latest technology with traditional shopping creates a unique experience that is difficult to compare with e-commerce.
Here, omnichannel shopping becomes perhaps the most effective solution. Customers search for products online and use physical stores as a place to come, evaluate, and purchase products.
Working with the layout of goods
Understanding the behavior of store visitors allows you to understand their needs and preferences. This knowledge allows you to optimize the placement of commercial equipment and work more efficiently with the layout. Therefore, merchandising and planograms are essential here. Knowing the places with a greater concentration of buyers, merchandisers place popular products there. The practical layout on the planogram and in the store allows you to increase the store's profitability. An attractive layout can draw the client's attention and increase sales.
Critical!
Consider seasonality, holidays, promotions, and historical sales when creating a layout. Use special layouts to make unique offers for your customers. Group products by brand, by purpose so that it is easy for customers to find and buy them.
Take care of the shelf's constant updating. Add new positions and remove slow-moving items and expired goods from the assortment on time.
How do you increase customer traffic in your store?
- Physical stores need an online presence. It increases awareness of the company, brands, and stores. We are talking about the website, presence on social networks, and advertising.
- In-store promotional events will also help attract customers. Reward customers with offers that your competitors don't have. Make them feel special and convince them to shop with you.
- Offer a store pickup service. Allows ordering goods online and picking up orders in the store.
- Use geolocation. This an excellent opportunity to attract customers who are close to the store. People who don't know about your store can find it using Google Maps. This is an additional opportunity for impulse purchases and attracting new potential customers.
- Offer additional free services if possible. For example, a pet supply store may offer regular customers a free veterinary consultation service.
Perhaps these ideas will come in handy depending on the format of your store. Or maybe you will have your own ideas to increase customer traffic and revenue.
Conclusions
The customer traffic on the store's trading floor seems uncontrolled and chaotic at first glance. You can manage this flow of customers to increase sales and revenue. However, this requires a preliminary analysis of how buyers are moving and their potential needs.
Finally, using the PlanoHero planogram software and the report on customer traffic, you can identify hot and cold zones and analyze the places of greatest and lowest sales. Such analytics allows you to understand what products are bought and which aren’t. It also allows you to find out the strengths and weaknesses of sales. Do you know the customer journey? Use this knowledge to form an attractive layout. Place the most popular product along the customer's path.
Update shelves, place new products, combine, and experiment!
Looking for a service to create planograms?
Try a free demo version of PlanoHero