
Last updated: September 20, 2026
What is Planogram Optimization?
Planogram optimization is the strategic process of organizing and adjusting in-store shelf layouts (planograms) to maximize sales, improve product visibility, and enhance the customer shopping experience. In practice, planogram optimization involves using data, analytics, and visual merchandising principles to ensure each product is placed in the right position, in the right quantity, and at the right time, all while aligning with your business goals.
Quick Example:
Before Optimization: A shelf layout is created manually, based on gut instinct or past experience, with minimal analysis of product performance.
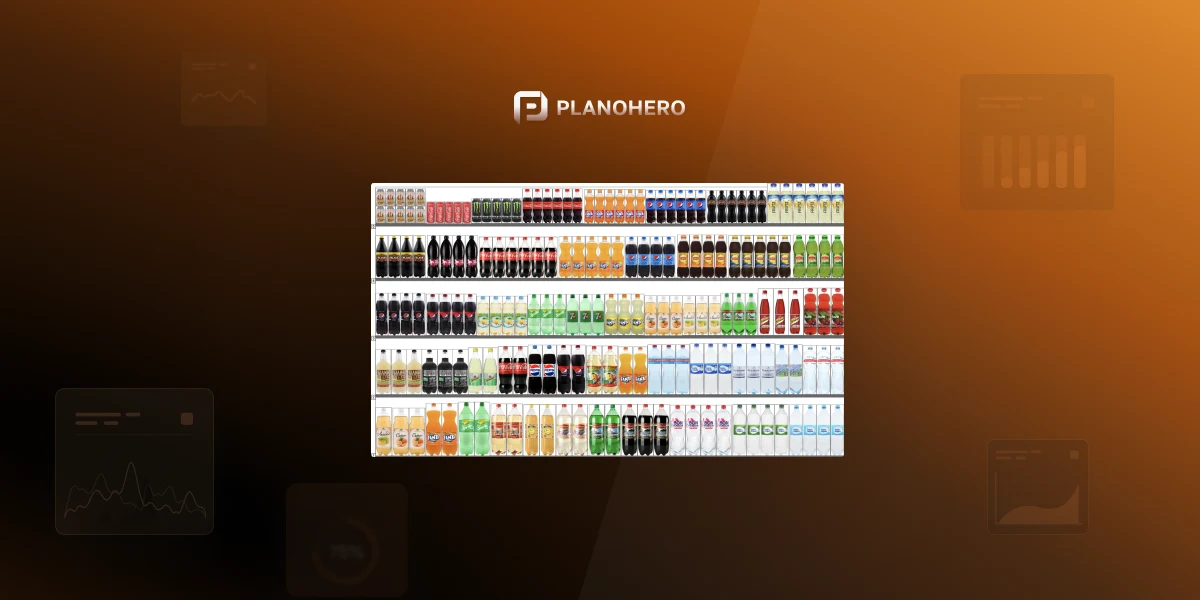
After Optimization: The same shelf is redesigned using real-time sales data, ensuring top-selling products are placed at eye level and complementary items are grouped effectively, boosting both visibility and sales.
Why Planogram Optimization Matters
Key Statistics:
- Planogram optimization can increase category sales by up to 12–20%.
- Retailers who implement planogram optimization tools report up to 30% reduction in out-of-stock (OOS) instances.
- Compliance with optimized planograms leads to 20–40% higher execution accuracy.
Who Benefits:
- Retailers: Improve shelf productivity, reduce stockouts, and boost shopper engagement.
- Brands (CPGs): Enhance product placement, support launches, and drive in-store promotions.
- Supply Chain: Improve demand forecasting and shelf replenishment accuracy.
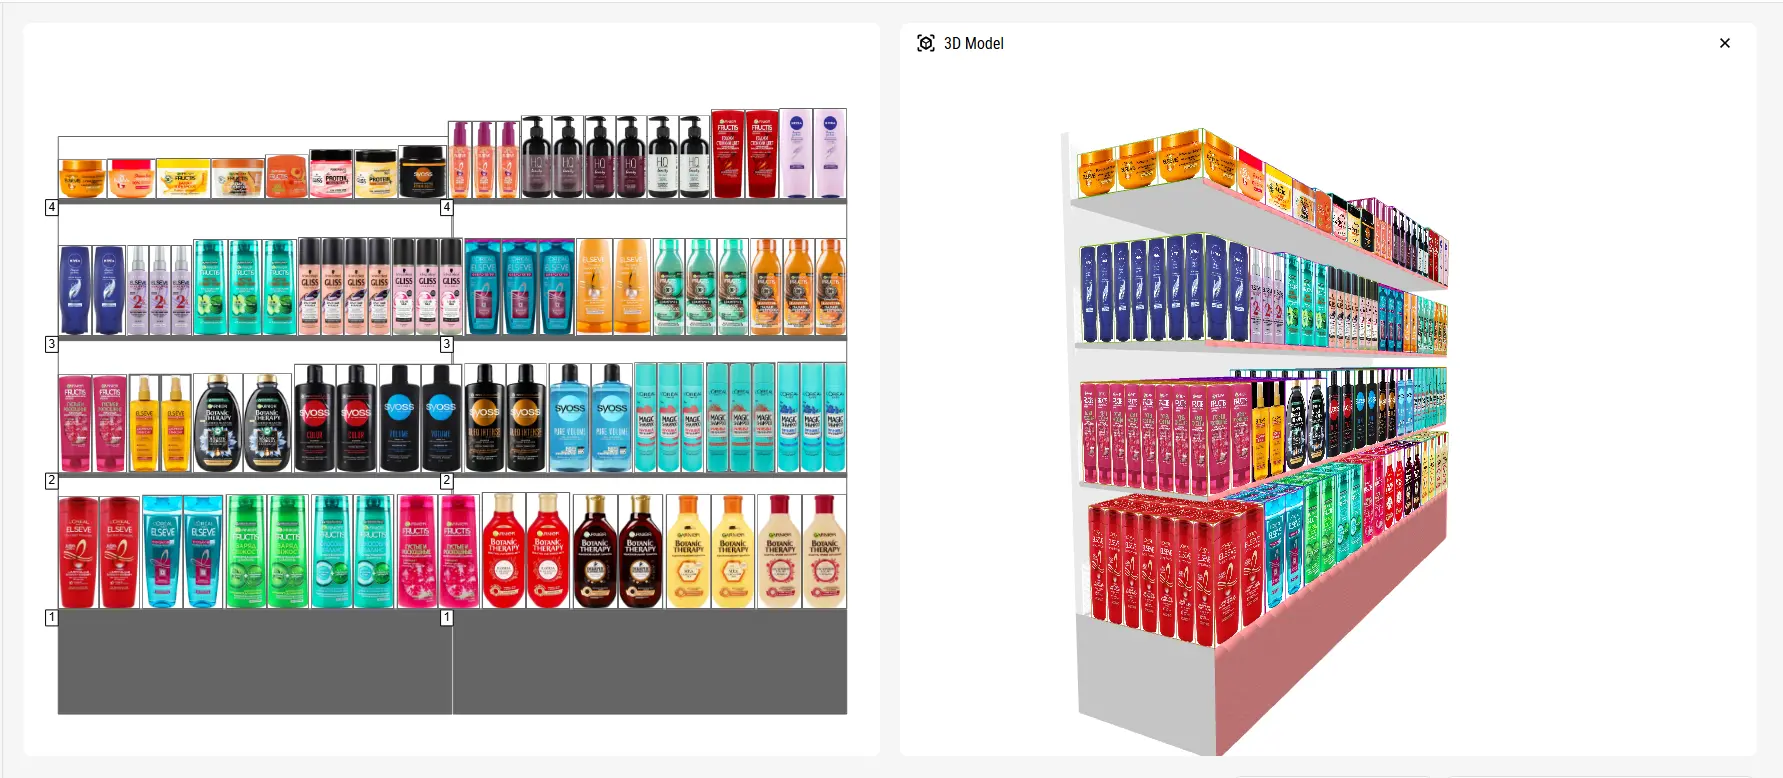
How Planogram Optimization Works (Step-by-Step)
1. Analyze Sales, Shopper Behavior & Layout Efficiency
Planogram optimization starts with deep data analysis. This means not only reviewing point-of-sale (POS) data, inventory metrics, and shopper behavior, but also evaluating the layout efficiency across your entire retail chain.
Using the PlanoHero analytics, retailers can:
- Monitor and compare key performance indicators (KPIs) across stores, categories, brands, and even individual products.
- Visualize data to identify underperforming layouts or hidden issues.
- Track the performance of both individual planograms and full store plans, including metrics such as turnover, number of receipts, sales, profit, and inventory levels.
- Drill down into featured product performance to assess the effectiveness of promotional placement.
The result is a data-backed foundation that turns raw metrics into actionable insights, helping you make smarter layout decisions and maximize shelf impact.
2. Align Space to Sales Ratio
Once you've identified top-performing products and weak spots, the next step is to align shelf space with real demand.
Using PlanoHero's integrated reporting tools, you can:
- Track planogram-specific sales performance.
- Adjust shelf space allocation based on actual turnover and inventory movement.
- Reduce overstocking of slow movers and understocking of bestsellers.
This ensures your most profitable SKUs are prioritized, while low-performing items are managed more efficiently, all contributing to an optimized, revenue-driving shelf strategy.
3. Apply Visual Merchandising Rules
Ensure category blocking, brand blocking, and product adjacencies follow best practices. Use data to drive adjacency planning: placing complementary products next to each other, such as coffee and creamers or pasta and sauce, increases cross-selling and boosts overall category performance. Group by color, size, or use case to create visual harmony.
4. Use AI Rules for Layouts & Automation
AI-powered tools like PlanoHero make planogramming faster and far more scalable by allowing retailers to generate layouts based on dynamic rules. With just a few inputs, you can define detailed layout conditions including product groupings by category, brand, shelf, or price, as well as constraints like display height or number of facings. These rules can then be applied chain-wide, ensuring consistency and strategic alignment across all store locations.
Beyond rule creation, PlanoHero's AI automatically fills empty shelf space with suitable products, maximizing every inch of shelf space while avoiding stockouts. The system helps retailers improve execution speed and saves time and resources, turning planogramming from a manual task into an organized, data-driven process. Retailers using automation for planogram generation can reduce planning labor by up to 25%, even as the number of managed planograms increases.
5. Human Review & Final Approval
Merchandising managers review generated planograms, make strategic adjustments, set execution deadlines, and push planograms to stores via digital platforms.
Why Store-Specific Planograms Matter More Than Ever
No two stores are identical. Different locations have different foot traffic patterns, shelf dimensions, customer preferences, and local demand profiles. Yet many retailers still use centralized, uniform planograms that don't reflect these nuances.
That's where store-level planogram optimization becomes valuable. By tailoring layouts to each location's real sales and stock behavior, retailers can reduce overstocks, improve shelf availability, and respond to local market needs with precision.
For example, a suburban store might see high demand for baby care goods, while an urban store in the same chain may need more shelf space for ready-to-eat meals. A one-size planogram cannot support both efficiently. Store-specific layouts can.
Common Challenges and How to Overcome Them
Resistance from Store Teams
Solution: Offer mobile tools (like PlanoHero's mobile app) for easy access and reporting, and involve store teams early in the rollout process. Gamifying planogram compliance with internal scorecards and incentive programs can also help increase motivation and adherence among store staff.
Low Data Quality
Solution: Implement a central product database with accurate SKUs, stock levels, and sales data. Use PlanoHero Connector, an easy-to-use tool for uploading data to PlanoHero. Set a schedule for data updates and save time with an automated data upload process.
Poor Product Category Roles
Solution: Define clear category roles for the products and align layout strategies accordingly using analytics. Assign a clear role to each category based on shopper behavior and business goals. Common roles include:
- Destination (draws customers in, e.g., diapers, coffee).
- Routine (regularly purchased items, e.g., milk, bread).
- Impulse (grab-and-go purchases, e.g., candy, batteries).
- Seasonal or Occasional (holiday items, BBQ supplies).
Once roles are assigned, use analytics to determine the best shelf space, product assortment, and placement strategy for each type. This makes your layout more intentional, shopper-friendly, and sales-driven.
How Technology Supports Planogram Optimization
- Centralizes product and sales data for accurate analysis
- Automates layout generation and compliance control
- Provides real-time feedback through photo validation
- Saves time on manual resets and updates
Solutions such as PlanoHero combine these capabilities, helping retailers move from manual planning to data-driven execution.
Tools & Technologies for Planogram Optimization
The right technology can turn a manual, inefficient process into a strategic advantage.
PlanoHero: AI-Powered Planogramming Tool
- Automates the creation, editing, and distribution of planograms.
- Offers realogram control with photo reporting.
- Includes analytics for products, categories, stores, and hot/cold zone detection.
- Mobile apps for store managers.
Planogram Optimization Best Practices
- Seasonal Adjustments: Shift layouts for holidays, back-to-school, summer sales, etc.
- Regional Customization: Adapt planograms to local preferences and store formats.
- Top SKU Positioning: Prioritize bestsellers in prime shelf locations.
- Realogram Validation: Use photo reports to verify execution in-store.
- Eye-Level Strategy: Follow the "eye-level is buy-level" principle to boost the product pickup rate.
- Continual A/B Testing: Compare different layout versions using performance data to uncover new optimization opportunities before rolling out changes chain-wide.
SOCAR - PlanoHero Case Study
After digitizing its planogram process, one international retailer reduced reset time by 40% and improved on-shelf availability across 50+ stores.
The result: faster implementation and better merchandising control.
SOCAR, an international gas station chain operating 54 locations with retail markets across Ukraine, manages a wide assortment of over 10,000 SKUs. To support efficient merchandising and maintain consistency across its chain, SOCAR sought a solution to modernize and improve its planogramming process.
By implementing PlanoHero, SOCAR digitized its workflow and introduced centralized management of planograms. The platform enabled smooth communication between headquarters and store teams, incorporated real-time photo validation for planogram compliance, and eliminated the need for printed layouts. Additionally, merchandisers began using PlanoHero's mobile apps to quickly access and update planograms directly from the sales floor.
The result was faster planogram creation, better execution control, and improved team and operational efficiency across the retail chain.
Key Takeaways:
- Data-driven planogram optimization improves sales, accuracy, and shopper experience.
- Regular updates and visual audits are essential to maintain performance.
- Technology now allows real-time collaboration between HQ and store teams.
- Store-specific layouts outperform uniform, centralized planograms in chains with varied store formats or demographics.
If you're looking to modernize your shelf management process, exploring planogram automation software like PlanoHero can be a strong next step. See PlanoHero pricing
FAQ: Planogram Optimization Questions Answered
How often should planograms be optimized?
Every 3–6 months for most categories. Fast-moving categories or seasonal product lines often need more frequent adjustments, sometimes monthly.
Who should own the optimization process?
Typically, the Category Manager or Merchandising Team owns the process, with input from analytics and marketing on demand trends and promotional priorities.
What's the ROI of planogram optimization?
Depending on the category and execution quality, retailers can expect a 5-20% or higher sales uplift, along with fewer out-of-stock situations and better planogram compliance rates.
Can planogram optimization be automated?
Yes. Tools like PlanoHero use AI and data integration to generate layouts, balance facings, and apply layout rules automatically, cutting down the manual work involved in building and updating planograms.
How can retailers measure optimization results?
By tracking sales uplift, turnover rate, and planogram compliance accuracy before and after each optimization cycle, ideally comparing the same stores or categories over similar time periods.
Looking for a service to create planograms?
Try a free demo version of PlanoHero