
How to Calculate Inventory Turnover?
What is a Good Retail Inventory Turnover Ratio?
Inventory Turnover and Dead Stock
Why it's Important to Measure Inventory Turnover Ratio?
What is Inventory Turnover?
Retail inventory turnover (turns) is a measure that tells you how many times a store has wrapped its inventory (sold and replaced inventory) in relation to the cost of goods sold (COGS - the cost of goods sold) for a given period.
The inventory turnover ratio can help a business make better pricing, production, marketing, and purchasing decisions. It is one of the efficiency ratios that measure how efficiently a company uses its assets. You can determine how many days it takes to sell inventory by dividing the number of days in a period, usually a fiscal year, by the inventory turnover ratio.
Turnover in the Store
Turnover of goods (product circulation) is the movement of goods associated with their exchange for money. It is an economic indicator that shows the total value of sales of goods over time.
That is, turnover is an indicator of the dynamics of your store's sales. It is a term that defines how fast the goods turnover in the store. The higher and higher the turnover, the better: the goods do not linger on the shelves, they are quickly sold out, and, accordingly, profits increase. Turnover also refers to the total volume of goods sold over a certain period. In simple terms, it is how much you earned on the product per month, quarter, year, and so on.
The main difference between these indicators is that the turnover is measured in monetary terms, while the product turnover is measured in physical units of goods, and these indicators are used to evaluate various aspects of a retail store's activities.
It is very important for a store to analyze the turnover of goods, as it helps to solve a number of tasks:
- studying the dynamics of sales and achieving the set plans;
- identifying the groups of goods that have the greatest impact and those that are less profitable;
- studying the factors that influence the turnover, identifying potential reserves for increasing sales;
- identifying inefficient products that need to be discontinued.
In addition, the analysis of turnover helps to develop strategic plans for the store's future activities.
There is a standard formula for turnover:
How to Calculate Inventory Turnover?
Retail inventory turnover is a measure of the ratio of how fast an item is sold to its average inventory over a specified period of time. The inventory turnover ratio shows how efficiently a company uses its inventory by dividing the cost of goods sold by the average cost of inventory for the period.
Inventory Turnover Formula:
The cost of goods sold (COGS) is also known as the cost of sales. The cost of goods sold, which is usually reported in the income statement, is the cost of materials used to produce a product plus labor costs.
The average value of inventory is used to offset the effect of seasonality. It is calculated by adding the value of inventory at the end of the period to the value of inventory at the end of the previous period and dividing this amount by 2.
What is a Good Retail Inventory Turnover Ratio?
What does retail inventory turnover tell us?
One way to measure the efficiency of your retail business is to track inventory turnover. Retail inventory turnover shows how often a company replaces inventory in relation to the cost of goods sold. As a rule, the higher this indicator is, the better.
For example, a turnover rate of 12 means that, on average, inventory passes through the store once a month.
A low inventory turnover rate can be a sign of weak sales, excess inventory, or a product not properly priced and not in high demand, which could indicate merchandising problems, improper positioning, and ineffective marketing. A high turnover rate indicates high sales, but can also indicate inadequate inventory levels.
The store could sell even more products if they were in stock. That is, a high turnover rate may indicate that the store has not purchased enough products to meet demand. A high inventory turnover rate can also mean that the price of an item is too low.
At the same time, a high inventory turnover rate is better than a low one, unless it means you can't keep the product in stock, so you lose sales opportunities.
A low inventory turnover rate can only be an advantage during periods of inflation or supply chain disruptions if it reflects increased inventory, outpacing supplier price increases, or increased demand.
The speed at which a company can turn inventory is a critical indicator of business performance. Retail chains that turn inventory into sales faster tend to outperform their competitors. The longer a product is kept in stock, the higher the cost of storing it, and the lower the chances that customers will return to the store.
In addition, a product that is sold for a long time delays the stock of new products that may be more popular. A decrease in the inventory turnover ratio may also indicate a decrease in demand, forcing companies to reduce production volumes.
By tracking your inventory turnover rate, you'll gain a lot of insight into which products are best sellers and how you manage your inventory costs.
Inventory Turnover and Dead Inventory
Retail inventory turnover is particularly important information for maximizing the efficiency of selling perishable and other limited shelf-life products. Examples of such goods include food, trendy clothing, and periodicals. For example, an overstock of knitted sweaters or Christmas decorations can lead to unsold inventory and lost revenue, especially as the seasons change. Such unsold inventory is called obsolete or dead inventory.
Why Is It Important to Calculate Turnover Rates?
The importance of this indicator is related to the fact that profit arises with each "turnover" of inventory. For each inventory turnover, the company makes a profit, so if the turnover accelerates, the company makes more profit, and if it slows down, it loses it. Inventory turnover shows how long it takes to sell the average inventory in a warehouse and is calculated in quantitative or cost terms.
To assess inventory turnover, two indicators are used: the turnover ratio (how many turns the average inventory makes in a given period) and the turnover period (the duration of one turn in days or months). It is especially important to track inventory turnover for companies that have significant funds invested in inventory, as even a small change in turnover brings significant cash flow and additional profit.
How do I calculate inventory turnover per week or month?
Divide the real-time inventory balance by the number of sales for the week and multiply by the number of days.
What is turnover in simple terms?
Turnover is the period when you sell an average batch of goods. For example, if the standard batch of goods is 1000 pieces, and you sell 50 per day, then your turnover is 20 days.
Turnover ( in days) = 1000 pcs / 50 pcs = 20 days
Analyze Store Performance
By monitoring turnover and sales metrics, the retailer can assess the efficiency of the store in time. There are different ways to analyze retail chain data. The fastest and most effective way for working with large amounts of data is the analytical IT solutions used in retail to analyze and automate business processes.
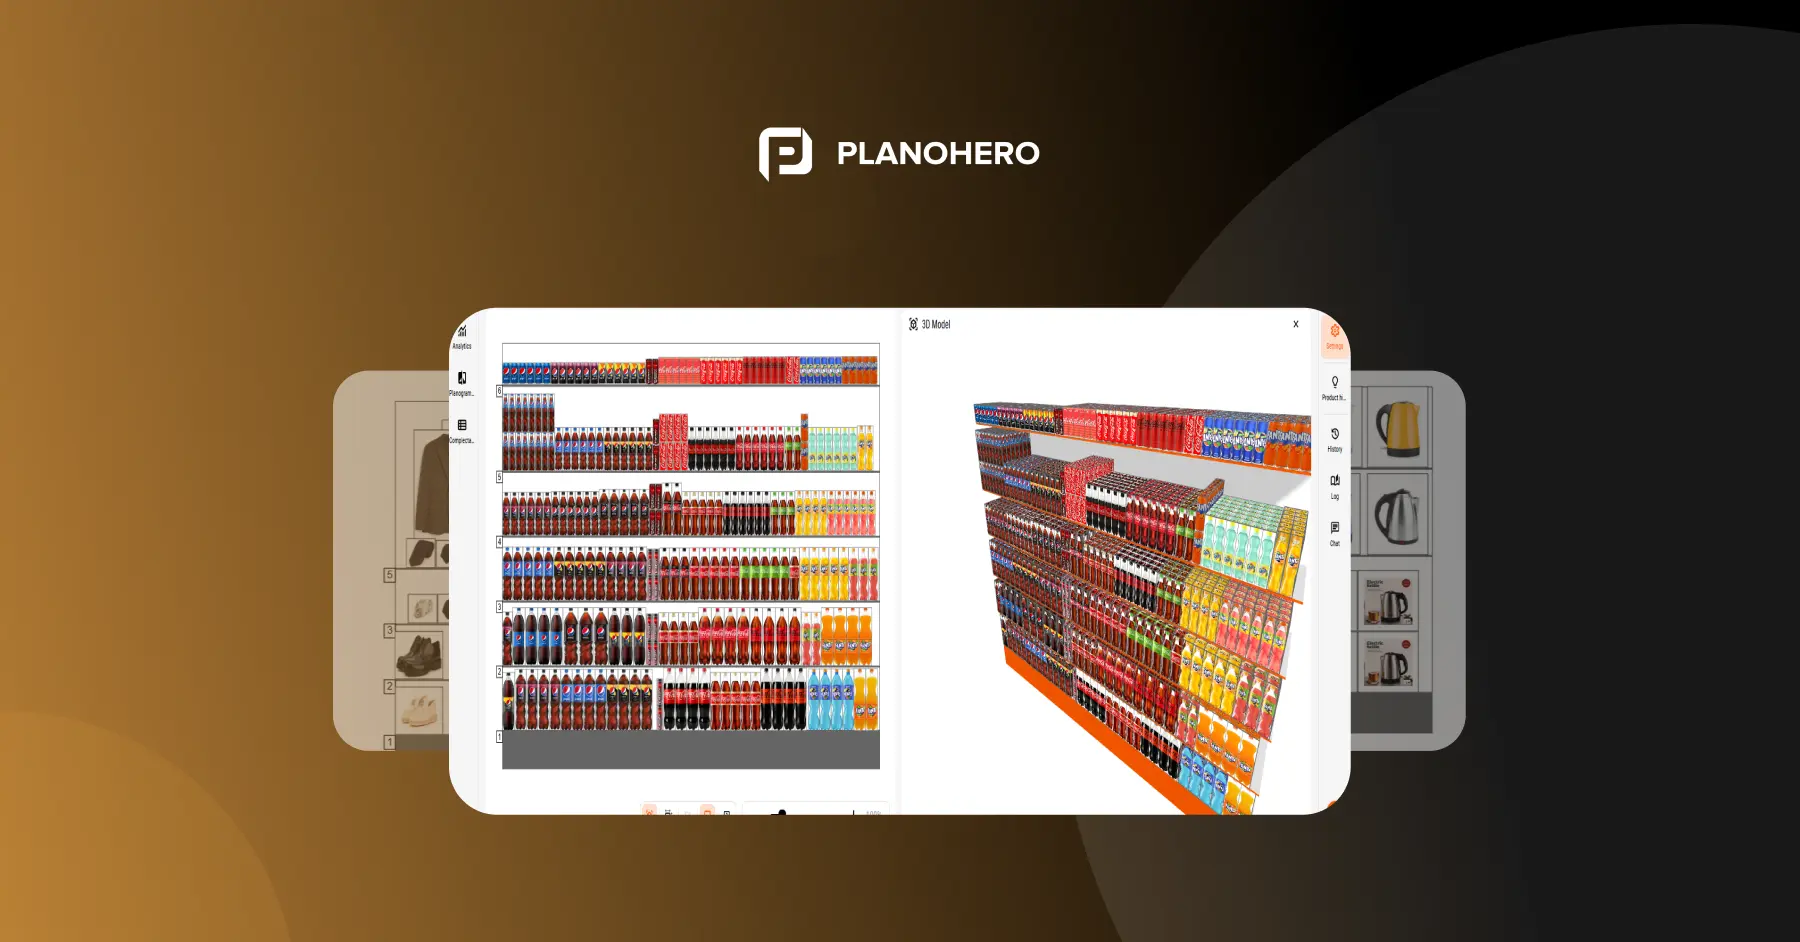
If you use the PlanoHero planogram tool, here you have the ability to analyze all of the major product sales metrics, turnover, profits, stocks, etc. Using one tool, merchandisers can not only create planograms and send them to the store for execution but also control the layout and analyze the sales of each SKU. The functionality of the service allows chains to get timely data on sales and analyze indicators: turnover, sales, profit, the quantity of stock, cost of inventory, etc.
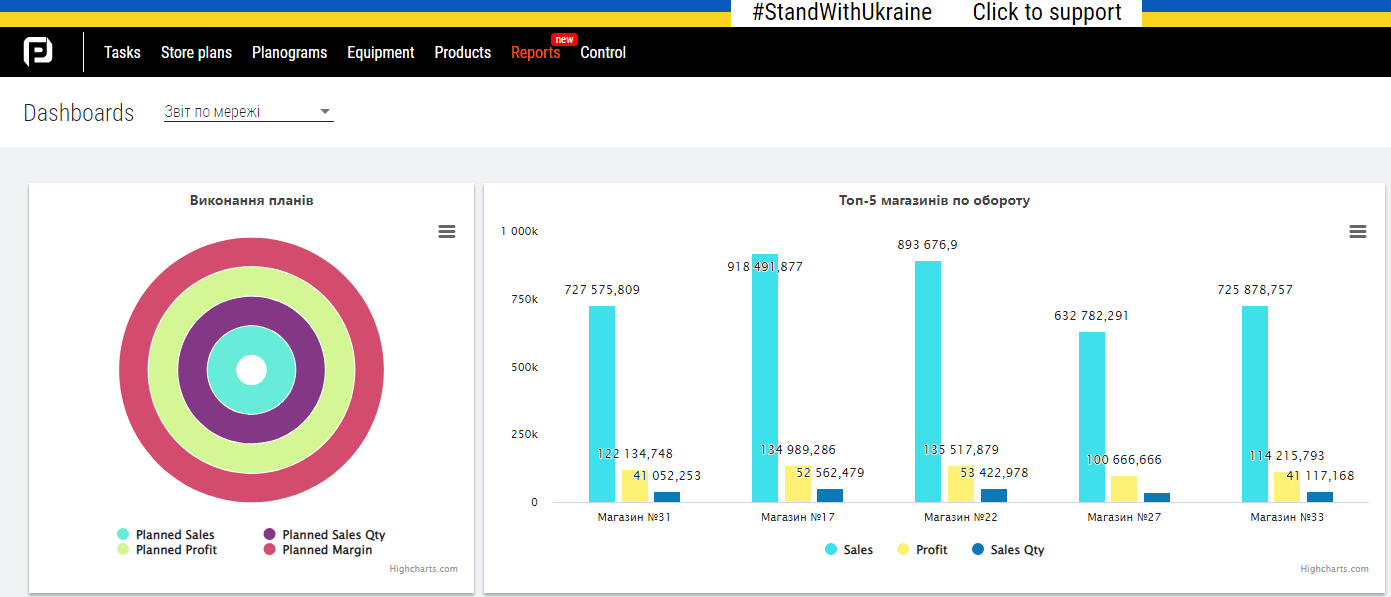
For convenient work with analytics, the service allows to look through BI dashboards. With dynamic dashboards, you can explore retail chain data, track sales data and make timely decisions to improve the entire chain.
Analyze the performance of your stores and increase turnover, sales, and profits with the unified automation platform PlanoHero!
Looking for a service to create planograms?
Try a free demo version of PlanoHero