
Last updated: September 18, 2026
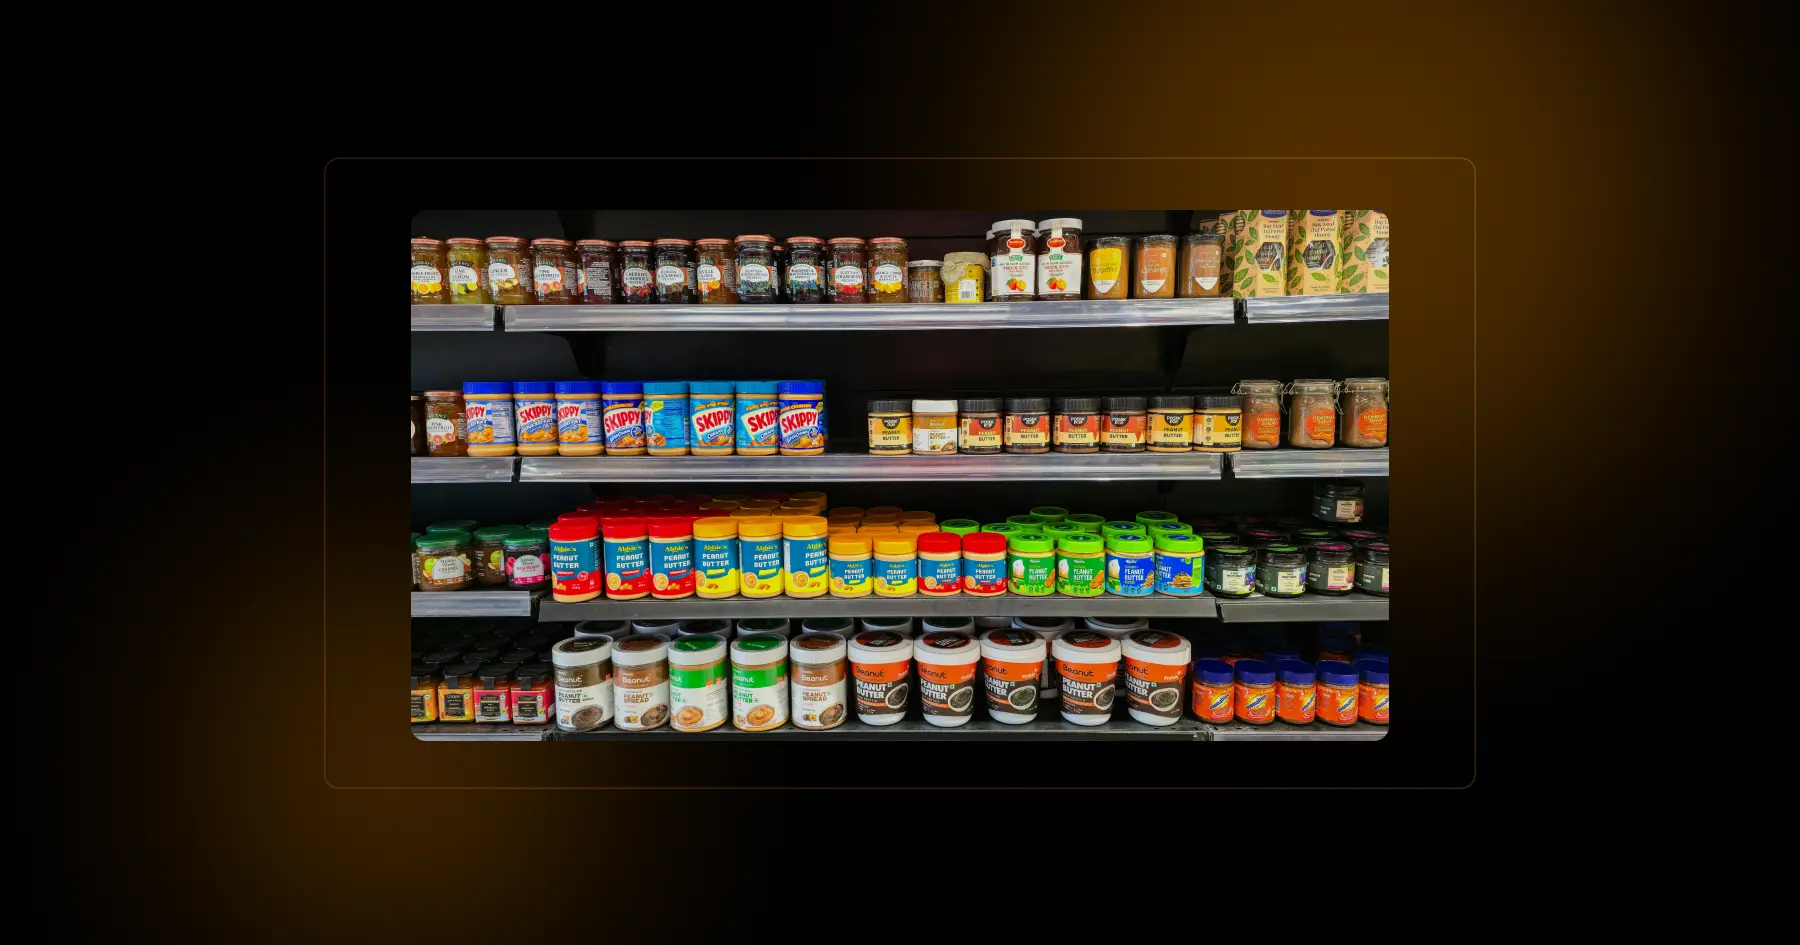
A product that isn't on the shelf can't be sold — no matter how well it sells everywhere else. On-shelf availability (OSA) is the metric that captures exactly this, and it's one of the most direct profit drivers in brick-and-mortar retail: every empty facing is a sale that likely just walked out the door to a competitor. Below, we break down what OSA actually means, how to calculate and improve it, and which tools can help you automate the process.
What Is On-Shelf Availability (OSA)?
On-Shelf Availability (OSA) is the percentage of time a product is physically present and visible on the shelf when a shopper wants to buy it. It's a shelf-level execution metric, not a warehouse or system metric: a product can show as "in stock" and still have 0% OSA if it never makes it out of the backroom.
What's the Difference Between OSA and OOS?
These two terms measure the same problem from opposite sides:
- OSA measures availability — the share of time a product is present and visible on the shelf.
- OOS measures absence — the share of time it isn't.
If OSA goes down, OOS goes up by the same amount. Retailers typically track OSA as the primary KPI, since it reflects overall shelf health rather than isolated stockout incidents.
OSA Formula
OSA (%) = (Number of SKUs available on shelf ÷ Total listed SKUs) × 100
Example: A store carries 100 listed SKUs in a category. During a shelf audit, 92 are physically present and visible, and 8 are missing.
OSA = (92 ÷ 100) × 100 = 92%
That also means the OOS rate for that category is 8%.
What's a Good OSA Benchmark?
Benchmarks vary by category and retail format, but a strong OSA rate typically falls between 95% and 98%. High-velocity and promoted SKUs should be held to the higher end of that range, since even small drops there create outsized revenue loss. Below 95%, retailers usually start seeing measurable, avoidable sales leakage.
100% OSA is rarely realistic — demand spikes, supply variability, and human error make some gaps unavoidable. The practical goal isn't perfection; it's catching gaps quickly and closing them before they cost sales.
A note on "hero SKUs": not every product needs the same level of attention. A hero SKU is the best-known, most in-demand item in a category — often the reason a customer walks into the store in the first place. Keeping hero SKUs consistently on shelf protects far more revenue than spreading equal effort across your entire assortment.
Why Does On-Shelf Availability Matter?
Industry research gives a sense of scale: a large-scale global out-of-stock study found the world average OOS rate sits around 8.3%, according to the joint GMA/FMI/CIES worldwide out-of-stock study, and separate research from IHL Group puts the resulting global cost at nearly $1 trillion a year, as Retail Dive reported. The pattern behind those numbers matters more than the exact figure — most OOS problems originate in-store, not upstream in the supply chain, with store-level responsibility estimated at roughly 75% by a 2003 academic study on retail out-of-stocks: shelves that are empty, planograms that are out of date, or stock that's sitting in the backroom instead of on the shelf.
When a product isn't available, the sale is rarely just delayed. Shoppers typically do one of the following:
- Switch to a competing brand
- Choose a substitute product
- Buy the item at another store
- Skip the purchase entirely
Repeated stockouts also erode customer trust over time — shoppers who can't reliably find what they're looking for gradually shift their loyalty elsewhere, which is a harder loss to recover than a single missed sale.
What Causes Low On-Shelf Availability?
Low OSA is rarely caused by manufacturing or supply shortages alone. In most cases, product exists somewhere in the system — it just doesn't reach the shelf on time. The most common causes include:
- Replenishment delays. Staff don't check shelves often enough, refill routines are inconsistent, or supply problems and supplier-related issues delay the delivery of necessary products.
- Backroom stock not moved to the shelf. Inventory is physically in the store but never gets pulled forward — invisible to the customer either way.
- Inventory inaccuracy. Scanning errors, shrinkage, or misplaced items mean the system doesn't reflect what's actually on the floor ("phantom inventory").
- Broken planogram execution. Incorrect facings, misplaced SKUs, or an outdated layout can make products hard to find even when they're technically present. Incorrect product labeling can also make it difficult for shoppers to find the product they are looking for.
- Promotion-driven demand spikes. Inventory planning that doesn't account for a promotional surge leads to shelves emptying faster than expected.
- Improper planning and communication. Poor coordination between retailers, suppliers, and manufacturers can result in outdated products on the shelf, gaps in availability, or stock levels that don't match demand.
How to Improve On-Shelf Availability
Improving OSA comes down to disciplined store processes and fast detection — not any single fix. These are the core practices that consistently move the needle:
- Set clear replenishment routines. Define how often shelves get checked, with high-velocity SKUs reviewed more frequently than slow movers.
- Audit shelves regularly. Routine audits (SKU-level availability, facing checks, backroom-to-shelf movement) catch gaps before they show up in sales data.
- Prioritize high-impact SKUs. Not every product contributes equally to revenue — protect top-sellers, high-margin items, and hero SKUs first.
- Keep planograms current. A planogram that hasn't been updated for seasonal shifts, new products, or discontinued SKUs makes broken execution more likely, even when stock exists.
- Assign clear accountability. OSA needs an owner — someone responsible for shelf checks, replenishment, and escalating recurring gaps.
- Track root causes, not just incidents. Look for patterns: which stores, which SKUs, and which time periods see repeat stockouts, so you can fix the underlying process instead of firefighting one gap at a time.
- Use real-time alerts where possible. The faster a gap is detected, the shorter the revenue impact — this is where software has the biggest edge over manual checks.
- Measure OSA as a KPI. Include on-shelf availability in store and merchandising KPIs so that recurring shelf gaps can be tracked and addressed systematically.
- Monitor inventory and supply. Track inventory levels and supply processes together to identify potential availability problems before products disappear from the shelf.
Manual processes can support some of this at a small scale, but they get harder to sustain as SKU count and store count grow — checking hundreds of SKUs across dozens of stores by hand simply doesn't scale. Software built for planogram execution and monitoring automates detection, keeps planograms accurate, and flags gaps before they turn into lost sales.
Below is a curated list of tools used by supermarkets, pharmacies, convenience stores, and CPG field teams to improve availability, execution, compliance, and planogram accuracy — most of which offer a free trial so you can test the value before committing.
Top On-Shelf Availability Tools
ShelfScan
If you're struggling to understand what's actually happening on your shelves throughout the day, computer vision is no longer optional — it's essential.
What it does:
- AI-powered scanning of shelves using smartphones or fixed cameras.
- Instant detection of out-of-stocks.
- Shelf-share and facing accuracy insights.
- Photo-based audits that speed up store team workflows.
- Immediate feedback loops for retail execution teams.
Why it matters for retailers
ShelfScan gives you unbiased, real-time visibility into sales you're losing today, not just during manual walk-throughs. Retailers use ShelfScan to:
- reduce OOS by 20–40%;
- improve category performance;
- alert staff instantly when shelves need correction;
Best for: Retailers and CPG teams that want automated, always-on shelf visibility.
Free Trial: Yes.
VisitBasis
Great for retailers with regular audit cycles or outsourced merchandising teams.
What it does:
- Mobile-first retail audit workflows.
- SKU-level availability checks.
- Planogram compliance verification.
- Time & GPS stamping for rep accountability.
- Real-time reporting dashboards.
Why it matters for retailers
VisitBasis helps eliminate messy paperwork, inconsistent reporting, and subjective audits. HQ teams get reliable, structured data from the field — essential for accurate availability tracking and faster issue resolution.
Best for: Retailers and CPGs running repeated store audits or merchandising visits.
Free Trial: A free plan is available for up to 10 users.
Shelf Logic
For retailers who still prefer a traditional desktop approach to planograms.
What it does:
- Manual planogram design.
- Visual shelf layouts.
- Basic space planning analytics.
- On-premise, legacy-style workflows.
Why it matters for retailers
Some retail organizations still prefer full local control, without subscription-based SaaS. Shelf Logic remains a familiar tool for veteran space planners and smaller retailers.
Best for: Retailers with established internal processes who need a simple, reliable planogram builder.
Free Trial: Downloadable trial + live demo.
PlanoHero
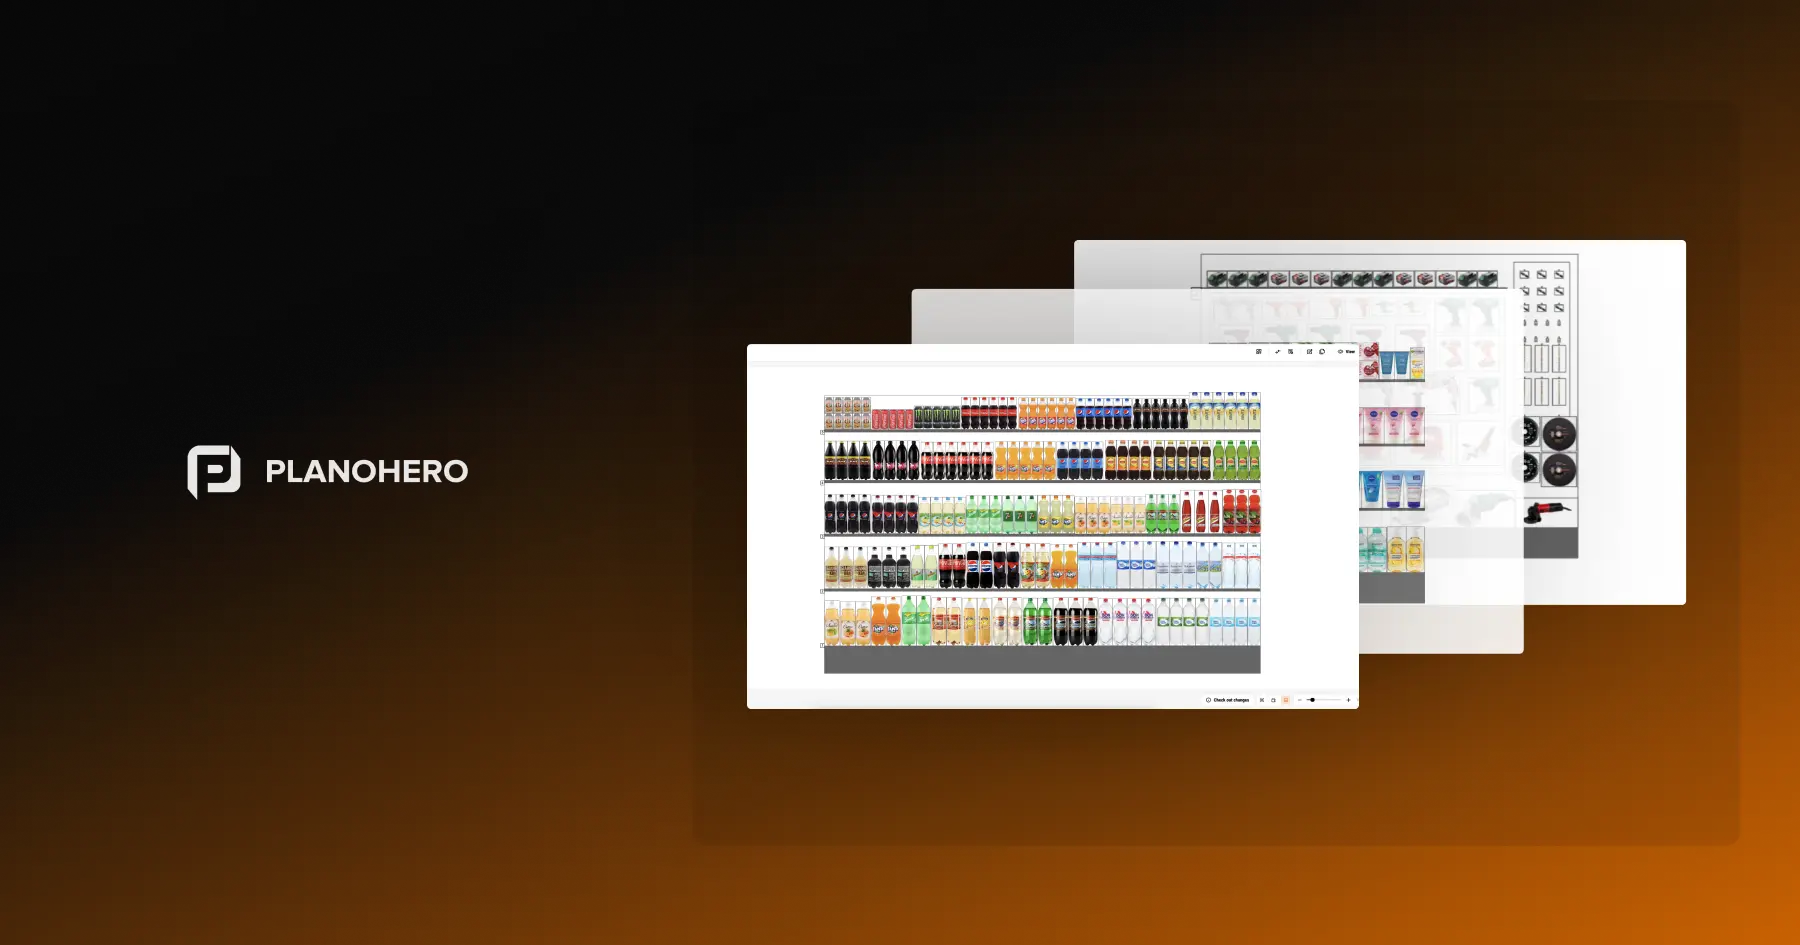
For retailers looking to modernize both planogramming and in-store execution, PlanoHero provides an integrated cloud solution that connects HQ planning with store-level performance.
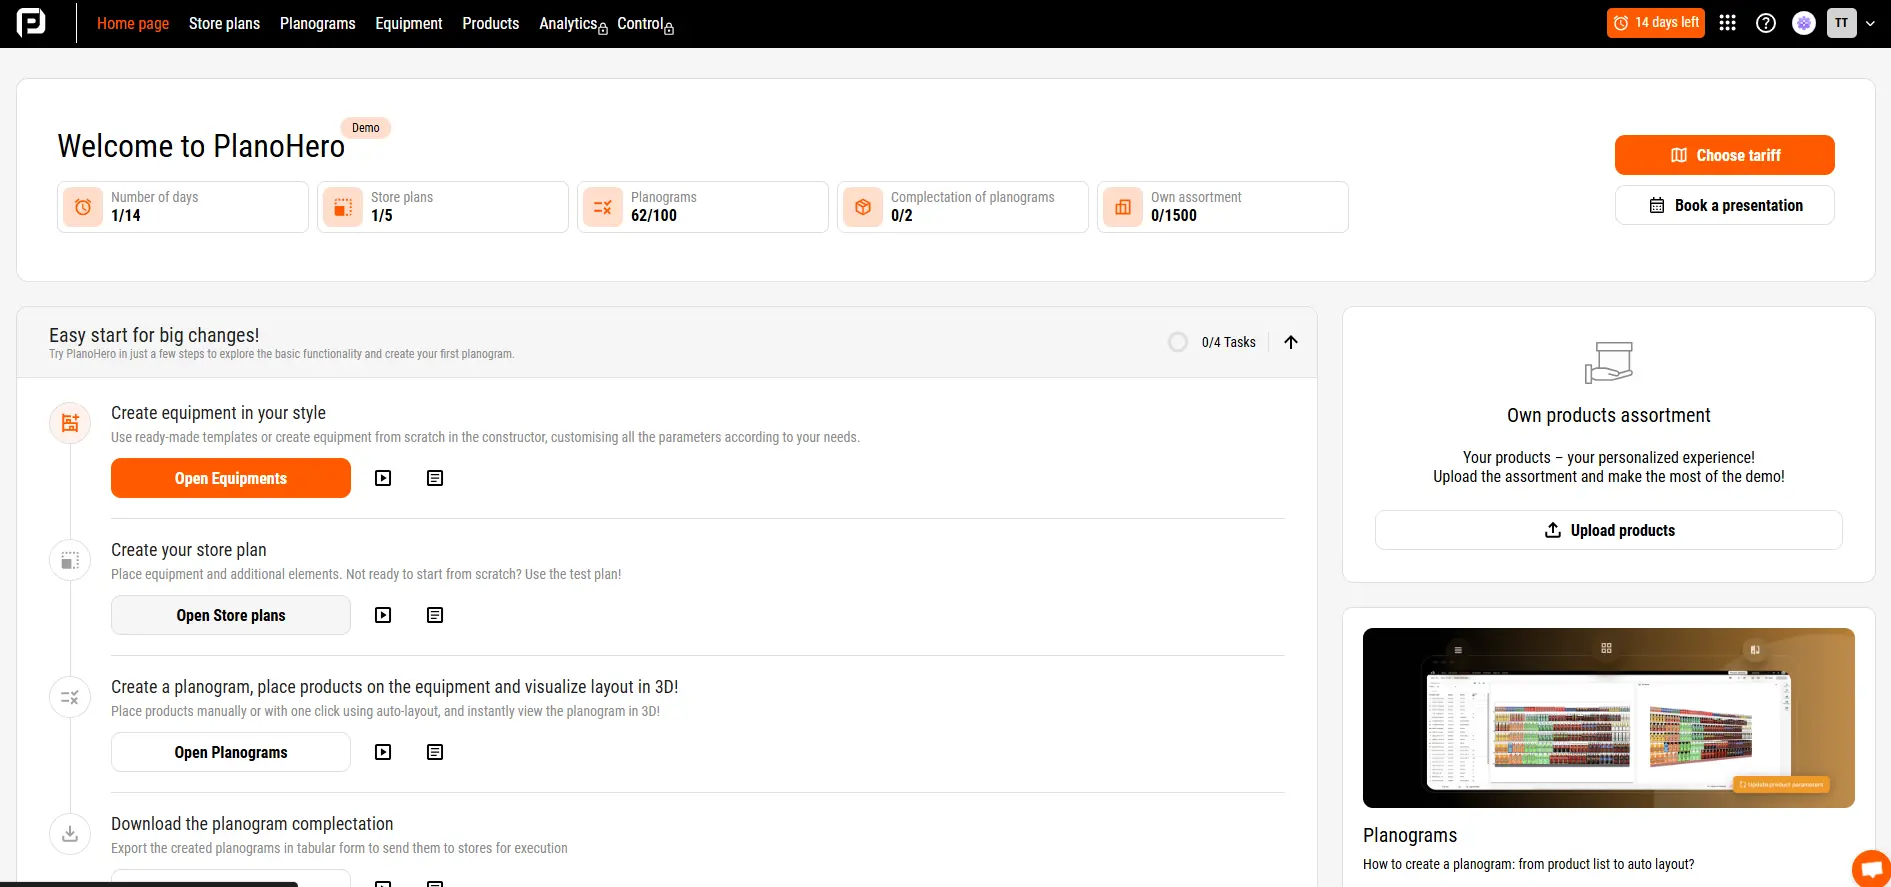
PlanoHero is one of the fastest-growing solutions in retail space planning, especially for multi-store chains looking to improve both planning and execution.
How it addresses the causes above: looking back at the common causes of low OSA, PlanoHero is built to close several of them directly. Its centralized distribution keeps every store working from the same up-to-date planogram, which cuts down on broken execution from outdated layouts. Photo-reporting and compliance tracking give HQ visibility into whether shelves actually match the plan, instead of relying on assumptions. And the built-in out-of-stock gap tracking (detailed below) catches missing SKUs and phantom inventory before they turn into a multi-day stockout.
What it does:
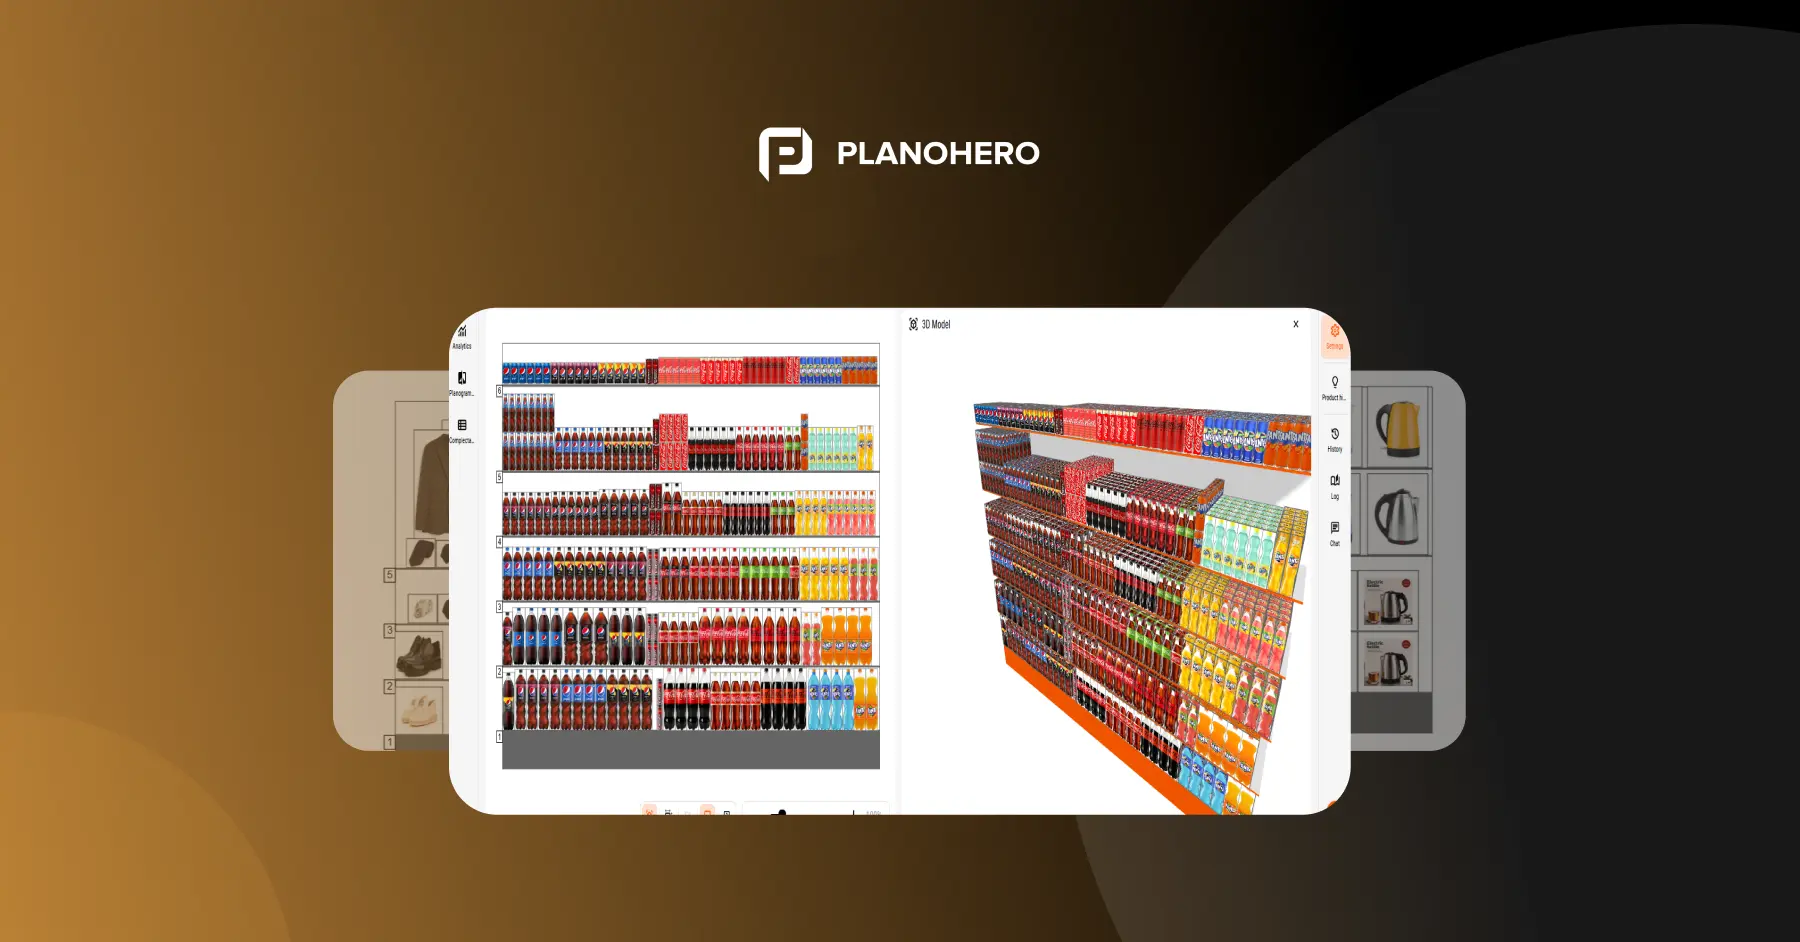
- Drag-and-drop or AI-automated planogram & store-layout creation (shelves, gondolas, racks, fridges, etc.).
- Assortment optimization and SKU-placement logic based on sales data, promotions, space allocation.
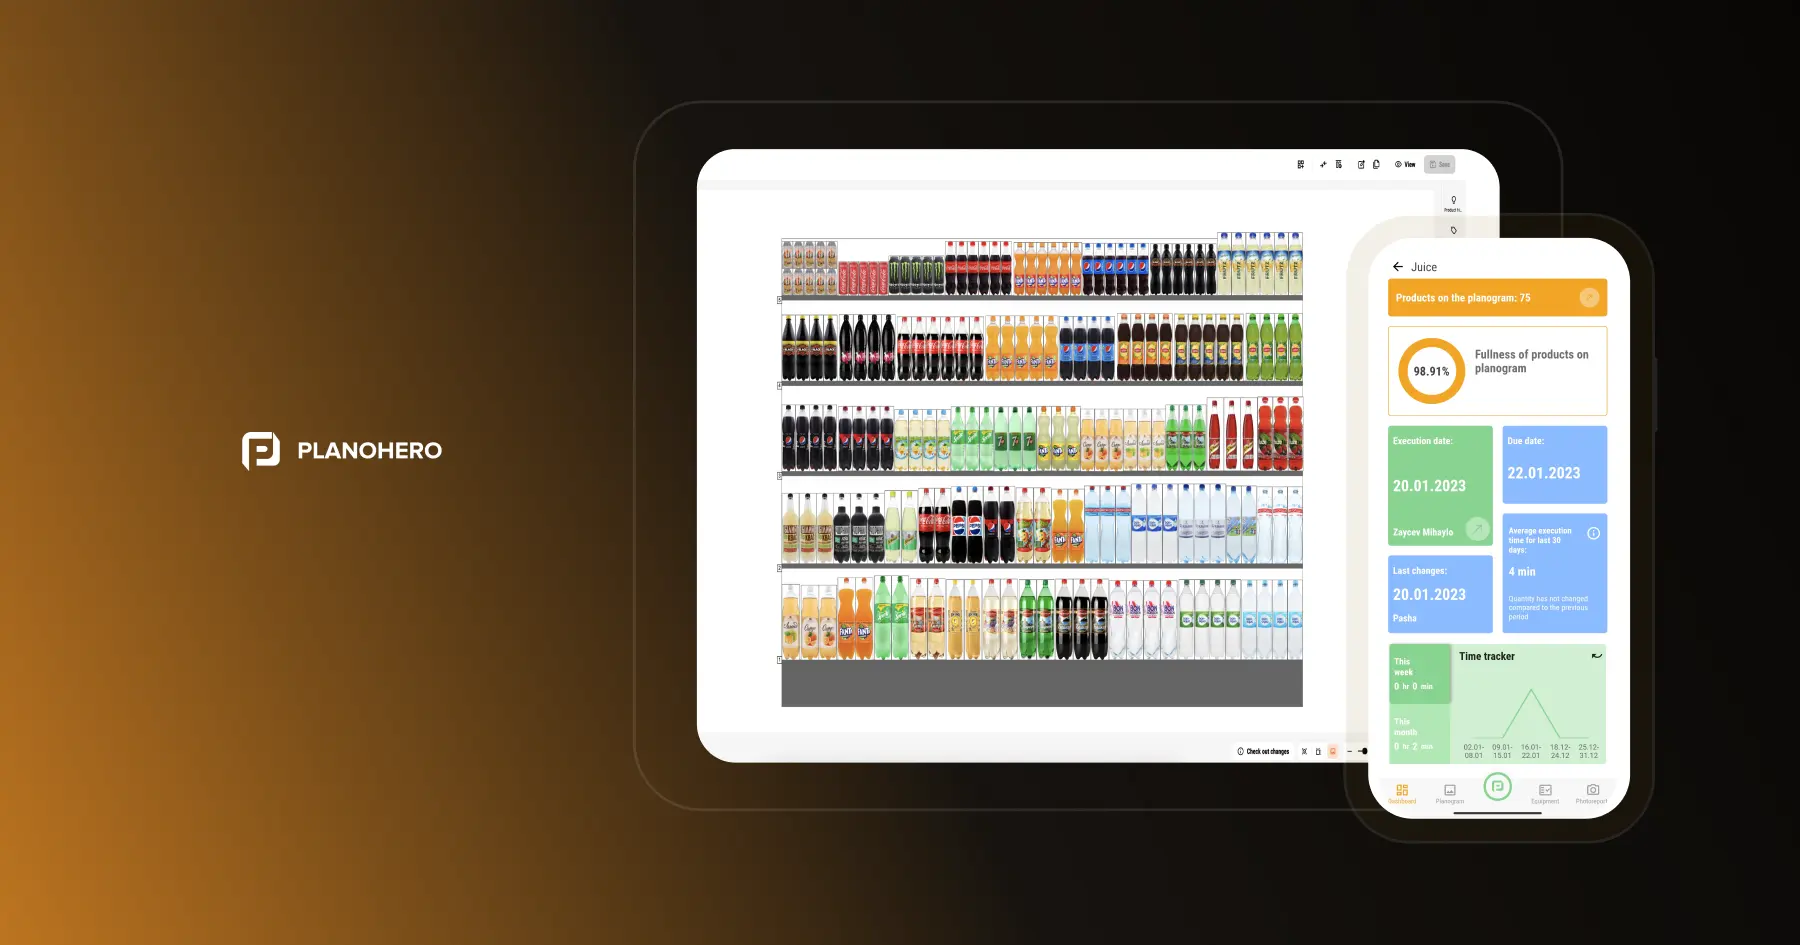
- Centralized planogram distribution to stores + mobile app for store execution (with photo-reporting & compliance tracking).
- Product rotation for quickly swapping merchandise on the shelf when the assortment changes.
- Analytics & reporting on shelf performance, layout compliance, SKU visibility, and space ROI.
- Built-in out-of-stock gap tracking, which flags items missing from the shelf and alerts the merchandising team daily.
Best for: Retailers and CPG teams needing comprehensive planogram management and merchandising execution across multiple stores (grocery, pharmacy, fashion, convenience, chains).
Free Trial: Available (demo version giving access to core planogram/layout tools).
A Closer Look: Tracking Out-of-Stock Gaps in PlanoHero
One specific feature worth calling out is PlanoHero's out-of-stock gap tracking. "Out-of-stock gaps" are items that appear on the planogram but aren't actually available — either missing from the shelf or from the store entirely.
The feature works like this:
- The system identifies items with zero inventory and automatically flags out-of-stock gaps.
- A dedicated "Out-of-Stock Gap Analysis" report lists everything that should be on display but isn't, including items with only one day of stock left — so teams can replenish before a full stockout happens.
- Data updates daily, and the merchandising team gets automatic alerts when new gaps appear, rather than discovering them during the next scheduled visit.
- A product highlighting tool lets teams visually flag zero-inventory items, near-depleted stock, duplicate SKUs, or imbalances by brand or category directly on the planogram — useful for spotting issues during planning, not just after the fact.
For example, if a retailer notices that shelves in a popular category are consistently empty every Friday ahead of the weekend rush, this data makes the pattern visible early enough to adjust replenishment in advance.
FAQ
What's the difference between on-shelf availability and stock availability?
Stock availability means the item exists somewhere in the retail system — a warehouse, a distribution center, or the store's backroom. On-shelf availability means it's physically present and visible where the customer expects to find it. A product can show as 100% "in stock" in the system and still have 0% OSA if it never actually leaves the backroom.
What is phantom inventory, and how does it affect OSA?
Phantom inventory is stock that the system shows as available but that isn't actually accessible on the shelf — caused by scanning errors, shrinkage, misplaced items, or stock sitting in the backroom. It's one of the most common reasons OSA figures look healthy on paper while shelves are actually empty, and it's why relying on system stock counts alone tends to understate the real scale of a store's availability problem.
How often should OSA be checked?
Daily or weekly gives a much more accurate picture than monthly or quarterly audits. A seasonal walk-through every 4–6 weeks leaves a wide window during which gaps go unnoticed and simply cost sales without anyone realizing it. This matters most for high-velocity and promoted SKUs, where even a few days of an empty shelf adds up to meaningful lost revenue.
How do you track OSA consistently across dozens or hundreds of stores?
At single-store scale, manual spot-checks are usually enough. Once a chain grows to dozens or hundreds of locations, checking every SKU by hand in every store stops being realistic — there simply isn't enough labor to do it reliably. Retailers at that scale typically need some form of standardized, store-comparable reporting (whether audits, sensors, or photo-based checks) so gaps in one location don't stay invisible to the rest of the network.
Can a product have low OSA even if the planogram is correct and the item is physically on the shelf?
Yes. OSA and planogram compliance are related but distinct. A product can be technically present on shelf and still fail to sell if it's obscured by other items, has too few facings, or is placed inconsistently with the intended layout. In that sense, a product can be "on shelf" by inventory logic but effectively invisible to the shopper — which is why shelf presence alone isn't a complete measure of availability.
Who should be responsible for fixing OSA gaps — the store or HQ?
Typically both, with different responsibilities. Store teams handle the immediate fix: shelf checks, pulling backroom stock forward, correcting misplaced items. HQ or category management is better positioned to spot patterns — which stores, which SKUs, which time periods see repeat stockouts — and address the root cause rather than the individual incident. Without a clear split, OSA problems tend to get noticed but not resolved, since neither side feels fully responsible for closing the loop.
Looking for a service to create planograms?
Try a free demo version of PlanoHero